




Every day, thousands of SOC and IR teams worldwide analyze suspicious files, emails, and links with ANY.RUN. Beyond individual investigations, this activity generates valuable data on emerging threats, industry trends, and SOC operational performance.
Drawing on real-world investigations across thousands of organizations, ANY.RUN provides visibility into threats affecting different sectors, from banking to retail. Security teams can see not only what they’re encountering, but also how those threats compare with the broader industry landscape.
Detecting a single threat gives you a verdict. Understanding it in the context of your industry’s threat landscape helps you make a decision.
This visibility helps SOC leaders benchmark performance, identify emerging risks, and make informed decisions about detection and response priorities.
To show what this looks like in practice, we examined 74,086 Sandbox analyses from one financial organization over a quarter and compared its findings with banking-sector benchmarks.
Key Takeaways
- Threat data reveals more than individual verdicts. It shows which submissions are most likely to be malicious, how quickly threats are detected, and which malware families are prevalent.
- Industry intelligence puts findings into context. Comparing an organization’s data with industry benchmarks reveals differences in threat exposure and helps prioritize security efforts.
- ANY.RUN already has visibility into threats across industries. Organizations can benefit from this knowledge without waiting to encounter every threat themselves.
- These insights can be applied to your own organization. ANY.RUN offers personalized demos using your organization’s data to show its threat landscape, SOC performance metrics, and industry comparisons.
What Can Threat Data Reveal About Your Organization?
Every suspicious file or URL analyzed contributes to a bigger picture of an organization’s threat landscape. Over time, this data reveals which submissions are most likely to be malicious, how quickly threats are detected, and where potential risks are concentrated.
Combined with industry-wide intelligence, these findings help security leaders understand not just what’s happening in their own environment, but how it compares with threats affecting their sector.
To illustrate this, we’ll use data from 74,086 Sandbox analyses conducted by an anonymized financial organization between March 30 and June 22, 2026.
The findings reveal some interesting differences between individual threat exposure and industry-wide trends.
Data Methodology & Privacy
The statistics in this article are generated automatically from public ANY.RUN analyses and telemetry shared by participating organizations. Industry-wide insights are based on aggregated data, without manual access to customers’ private analyses. Organization-specific reports are accessible only to the respective customer.
Which Submissions Are Most Likely to Be Malicious
Over the quarter, files accounted for 39.5% of submissions, while URLs made up the remaining 60.5%. The analyses covered four operating systems: Windows, Linux, Android, and macOS.
But what does this investigation volume reveal about the threats reaching the organization, and how does its detection performance compare with industry benchmarks?
The organization’s malicious yield was 12.8%, almost identical to the banking-sector median of 13.0%. Yet this overall figure hides significant differences between submission types.
| Total analyses | 74,086 |
| Analysis verdicts | 8,520 malicious · 992 suspicious · 64,574 clean |
| Analyzed sample types | 39.5% files, 60.5% URLs |
| Total malicious yield | 12.8% |
| Malicious yield by sample type | 58.8% for files, 25.6% for URLs |
Files showed more than twice the malicious yield of URL-based samples. The differences become even more apparent when looking at individual file formats.
PowerShell scripts had the highest malicious yield at 88.2%, followed by MSI installers at 75.2% and Outlook email files at 71.5%.
Executables followed at 70.5%, with Android APK files at 59.3%, ZIP archives at 51.4%, and EML email files at 41.9%.
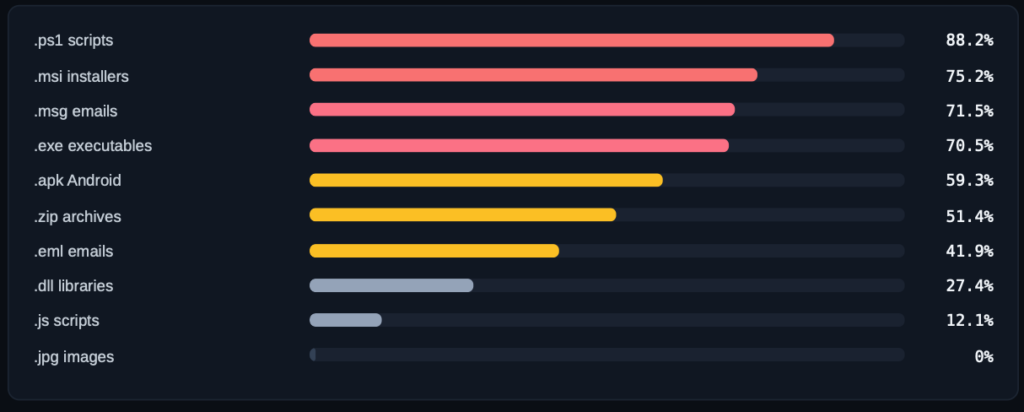
The findings show why file extensions and submission sources alone are insufficient for determining whether an object is malicious. Even common formats like ZIP archives had a malicious yield above 50% in this dataset.
For SOC leaders, these breakdowns provide visibility into where malicious findings are concentrated, helping teams review investigation priorities and workload distribution.
How Quickly Threats Are Detected
Despite the investigation volume and variety of submissions, the organization achieved a median time to detection of 15.1 seconds with ANY.RUN, compared with 16.9 seconds across the banking sector.
| MTTD | P95 Time to Detection | Threats Detected |
|---|---|---|
| 15.1 sec | 1.4 min | 4,874 |
| Industry median: 16.9 sec | 95% of measured detections occurred within this period | Recorded automatically over the quarter |
What’s more, half of all threats were detected within the first 16.7% of the Sandbox session runtime. In other words, malicious activity could often be identified well before the full analysis session was complete.
This is where ANY.RUN’s accumulated threat intelligence makes a difference. As suspicious files and links are investigated across organizations and industries, the resulting knowledge helps enterprises recognize previously observed threats and malicious behavior more quickly.
These metrics help SOC leaders move beyond individual verdicts to understand investigation workloads, benchmark detection performance, and make informed decisions about operational priorities.
How Your Threat Exposure Differs From Industry Averages
No single SOC can see the full threat landscape on its own. But by comparing an organization’s investigations with data from industry peers, security leaders can understand which threats are widespread, which are emerging, and where their own exposure differs from the sector average.
ANY.RUN provides this broader perspective for enterprise security teams through real-world investigations across organizations and industries. Let’s look at what the comparison reveals for the financial organization in our study.
| Metric | Finding |
|---|---|
| 19 unique malware families | Places the organization in the top 1% of banking-sector peers for observed family diversity |
| 10/10 sector-characteristic families | All ten families identified as characteristic of the banking sector were observed in the organization's analyses |
These findings show why industry benchmarks and organization-specific data need to be considered together. One reveals what’s typical for the sector; the other shows where an organization’s actual threatexposure differs.
The comparison also revealed a striking difference in threat composition. For the financial organization, 74.8% of analyzed threats were malicious code and 25.2% were phishing. Across the wider banking sector, phishing accounted for 88.9% of threats.
For SOC leaders, this distinction matters. Relying on sector averages alone could lead teams to underestimate the resources needed to investigate executable malware in their own environment.
Industry-wide intelligence shows what’s typical for your sector, while your own investigation data reveals where your exposure differs. Together, they provide a stronger basis for detection priorities and resource planning.
Which Threats Are Prevalent Across Your Industry
ANY.RUN’s data from 85 banking organizations shows which threats are most prevalent across the sector. For example, Sneaky2FA and Tycoon were observed in roughly 7 out of 10 organizations.
But the threat landscape extends far beyond a handful of common families. Across 380 malware families observed in ANY.RUN’s threat flow, even the most frequently detected accounts for just 4.8% of detections. This shows that threats aren’t concentrated in just two or three dominant families.
Stealer-type threats lead the observed behavioral categories at 38.4%, while ransomware accounts for just 1.6%.
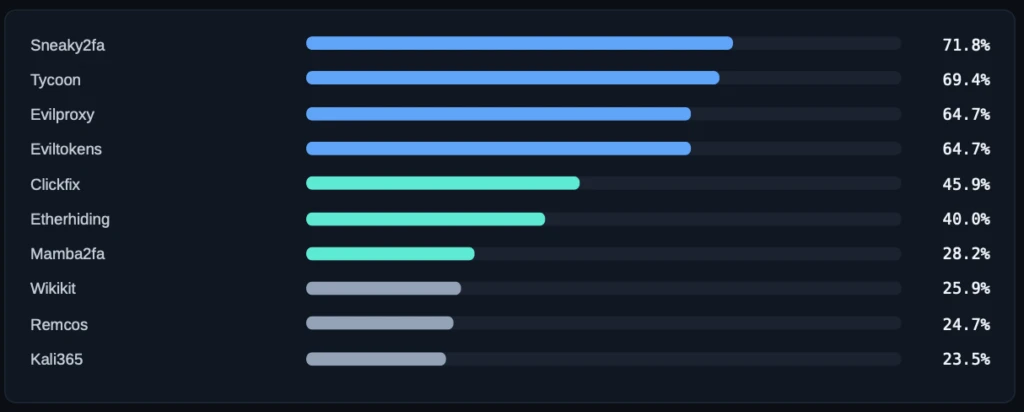
This is the core of ANY.RUN’s approach: organizations don’t have to wait until a threat reaches their environment to learn about it. Industry-wide intelligence is already available when the first suspicious file or link is submitted for analysis.
Drawing on investigations across the industry, ANY.RUN already has intelligence about which threats are prevalent, how they’re changing, and how frequently they appear among sector peers.
When a suspicious file or link is submitted for analysis, this broader knowledge helps put individual findings into context. For SOC leaders, it provides a stronger basis for reviewing detection coverage, prioritizing threat hunting, and allocating resources according to both industry trends and their organization’s actual exposure.
Why Does Consistent Threat Visibility Matter?
The findings demonstrate how fast detection and industry-wide threat intelligence provide visibility beyond individual investigations. But this visibility is most valuable when it’s part of everyday SOC operations, not just occasional incident response.
The organization maintained 100% working-day coverage, with a 9.2/10 team satisfaction score, CSAT of 80.5, and 74.9% 30-day retention.
Together, these metrics show that the insights come from consistent operational use, providing a foundation for ongoing SOC monitoring and reporting.
What Could ANY.RUN Reveal About Your Organization?
The findings above are just one example of what can be learned by combining an organization’s investigation data with ANY.RUN’s industry-wide threat intelligence.
For enterprise SOC teams, ANY.RUN can automatically generate dashboards with key threat landscape and operational metrics, helping security leaders monitor performance, identify trends, and make data-driven decisions.
Here’s what you can get with ANY.RUN:
| Reporting area | What you can track and measure | Example metrics |
|---|---|---|
| Operational management | Investigation workloads by day and hour, peak activity, and workload distribution across analysts to support staffing decisions. | Peak load 2.5× the median hour; 100%working-day coverage |
| Threat landscape research | Threats affecting your organization compared with industry benchmarks, including prevalent families and differences in exposure. | 19 malware families observed; top 1% among sector peers for family diversity |
| Executive security reporting | Detection speed, malicious yield, and threat breakdowns by file format, platform, and region, ready for leadership reporting. | 15.1 sec MTTD; 12.8% malicious yield |
| Investigation quality control | Analyst engagement with samples and activity following detection to identify excessive or insufficient manual investigation. | 140 interactions per task; 27.5% of session time spent actively investigating |
| Adoption and team satisfaction | Team usage, satisfaction, retention, and coverage across roles and regions to evaluate ongoing adoption. | 9.2/10 team satisfaction; 74.9% 30-day retention |
These insights support everyday operational management, industry benchmarking, and executive-level security reporting. SOC leaders can use them to monitor workloads, identify gaps, and present measurable findings to management.
About ANY.RUN
ANY.RUN provides malware analysis and threat intelligence solutions used by 700,000+ cybersecurity professionals across 16,000+ organizations, including 74 of the Fortune 100.
Its Interactive Sandbox enables SOC teams to safely investigate suspicious files, URLs, and malware, providing real-time visibility into threat behavior.
Built on data from real-world investigations, ANY.RUN’s Threat Intelligence Lookup helps teams validate threats, uncover context, and support detection and response. Threat Intelligence Feeds deliver fresh, actionable IOCs into existing security workflows.



0 comments