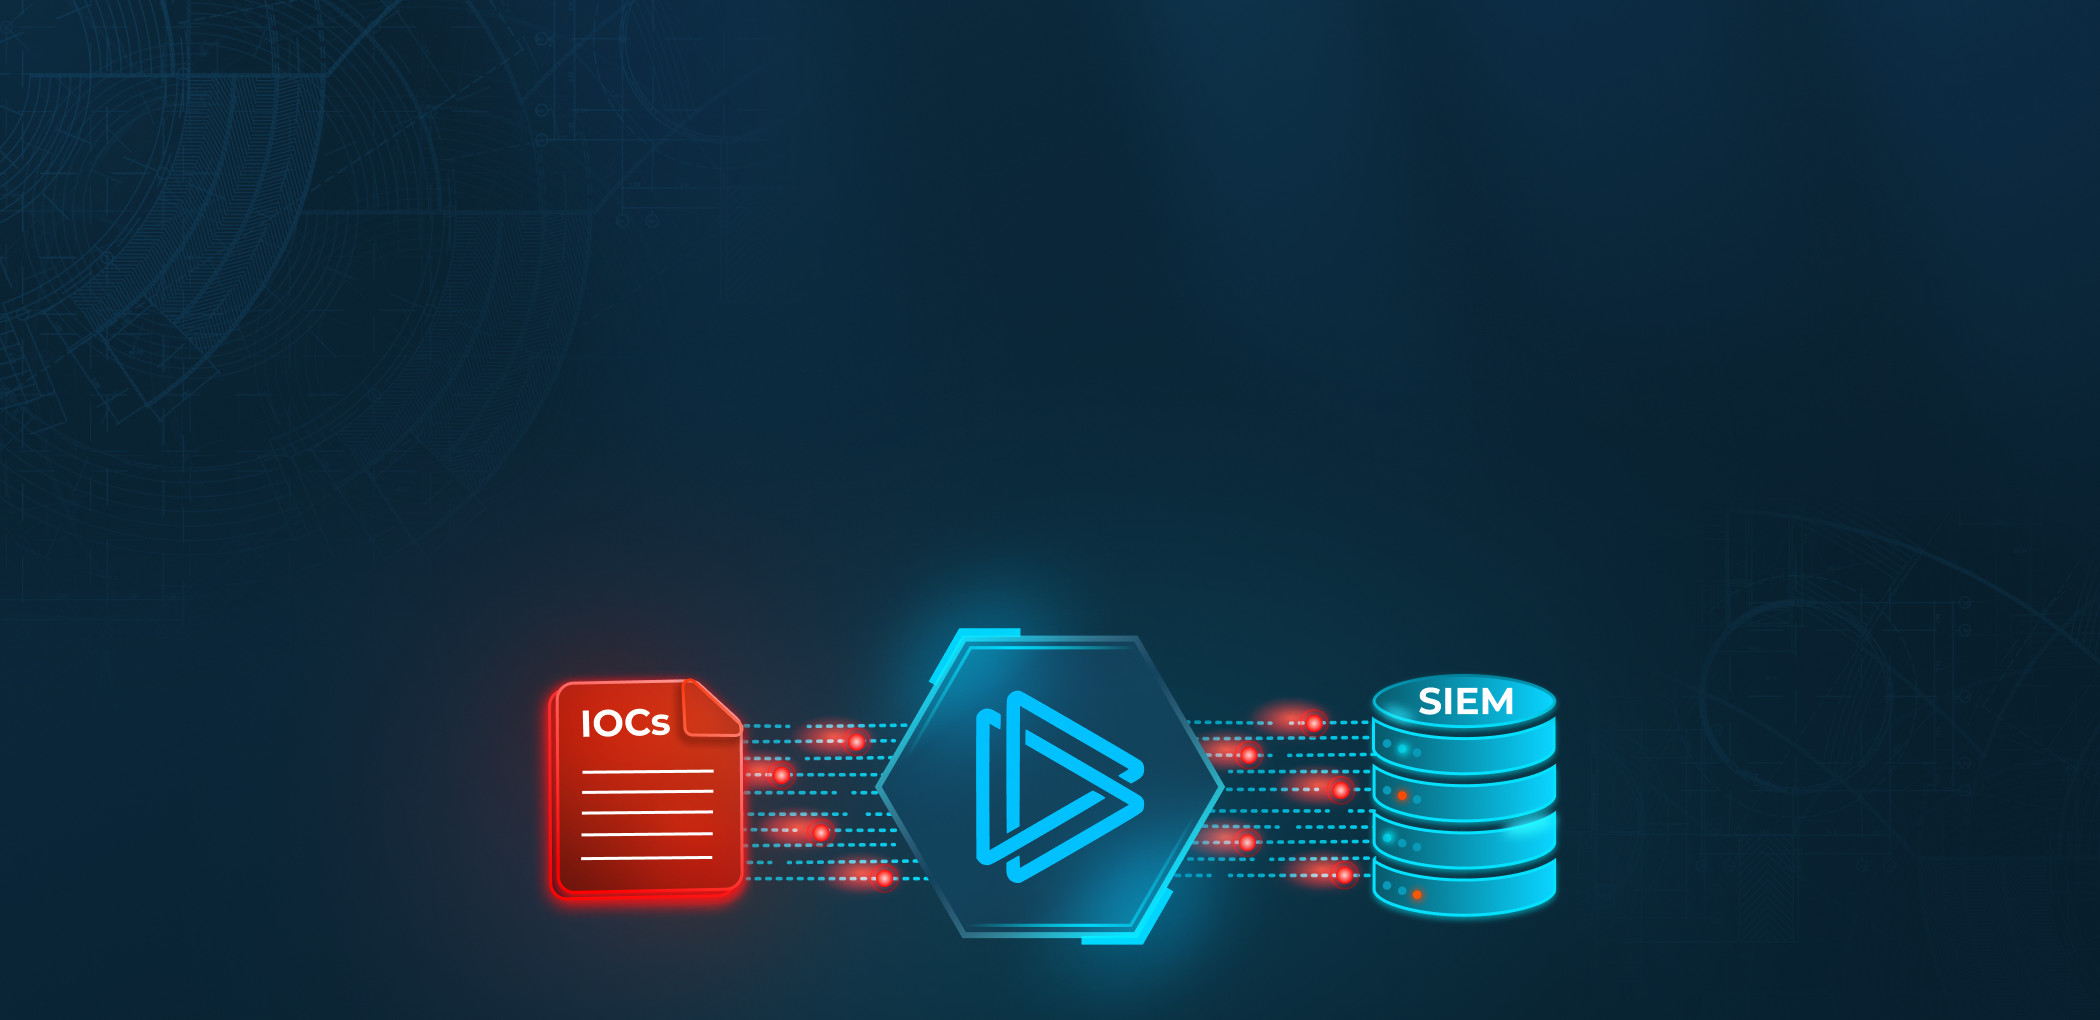
Threat Intelligence Feeds are data streams of indicators of compromise (like malicious domains, IP addresses, links and file hashes).
They enable SOC teams to quickly detect and respond to malicious activity, including the execution of zero-day exploits and emerging malware.
How Threat Intelligence Feeds Work
Feeds are structured streams of threat data, containing threat indicators like IP addresses, hashes, domain names, and related details such as ports that associated malware has connected to or threat names.
There are two main categories of feeds:
- Open-source feeds: These are data streams from public threat intelligence libraries.
- Commercial feeds. These are indicator streams from specific vendors who collect the data through their own proprietary channels.
Regardless of the type, feeds generally work like this:
- First, the provider gathers indicators from their intelligence sources and channels.
- The raw data gets structured, de-duplicated, and formatted into a standardized layout.
- All IOCs are then evaluated further, based on their confidence score and whitelisting checks.
- The compiled set of new indicators gets sent to subscribers at regular intervals.
On the receiving end, feeds are typically integrated into SIEM and TIP systems. The ingested data may get enriched by correlating with other sources to add more context around each indicator. It’s then used to generate detection rules, signatures, watchlists, and so on.
Overall, threat data feeds help security teams stay ahead of the latest threats.
It’s like tactical intel coming in from the front lines to headquarters. With it, teams can take preventive measures against emerging threats before they cause damage.
What are the different types of feeds
Let’s explore the various structures and formats in which feeds are delivered. This is important because the structure determines how comprehensive the data will be.
In general, a feed’s format is determined by the data model being used to represent the threat indicators.
The simplest type of feed contains just basic network and host indicators like IP addresses, domains, and file hashes. These can usually be represented in flat, non-nested structures like CSV format:
| 901 | 193.161.193.99 | ip-grave.gl.at.ply.gg | E159588DC7E35EAC705419AD5224449773ED8745D7FD5E92FA83996043377066 |
| 900 | 147.185.221.17 | 2.tcp.eu.ngrok.io | D826957796B97F6E5D38B8ED7D55F8D36C20AEA2CB228147476456DBE23E05D9 |
However, to provide linked/relational data, a flat structure is no longer sufficient. Simply listing atomic indicators is not enough — you need to represent them as bundles of related indicators forming complex objects. This is difficult to do in a linear format.
For these more advanced data models, formats like JSON or the STIX standard are used. STIX, which powers most SIEM and TIP platforms, allows enriching individual indicators with additional context. For example, in feeds from ANY.RUN, it looks like this:
{
  "type": "ipv4-addr",
  "id": "ipv4-addr--8c851c0c-ee42-5e7e-af06-f849efc0ffb4",
  "value": "194.104.136.5",
  "created": "2022-04-20T15:05:54.181Z",
  "modified": "2024-02-19T11:21:47.728Z",
  "external_references": [
    {
      "source_name": "ANY.RUN task c761d29c-a02a-4666-bc34-b89c4aab5cd1",
      "url": "https://app.any.run/tasks/c761d29c-a02a-4666-bc34-b89c4aab5cd1"
    },
    {
      "source_name": "ANY.RUN task 49e5fc75-a203-4d98-b055-ce41b0597a42",
      "url": "https://app.any.run/tasks/49e5fc75-a203-4d98-b055-ce41b0597a42"
    },
    {
      "source_name": "ANY.RUN task 3438d5ce-3cfa-4ccc-9638-5d92ad34b406",
      "url": "https://app.any.run/tasks/3438d5ce-3cfa-4ccc-9638-5d92ad34b406"
    },
    {
      "source_name": "ANY.RUN task e4ca3451-ce2c-4974-a6f5-baf3e81b5aff",
      "url": "https://app.any.run/tasks/e4ca3451-ce2c-4974-a6f5-baf3e81b5aff"
    }
  ],
  "labels": [
    "RedLine"
  ]
}
Below we have described what you can learn from such a feed:
- Type: Specifies the category of the indicator.
- Id: A unique identifier in a standardized format.
- Value: The indicator itself.
- Created: When the indicator was first added to our system.
- Modified: When the indicator was last modified.
- External References. Related analysis sessions in which this indicator was found.
- Labels: Tags, such as threat names associated with the indicator.
What to look out for when Choosing Threat Intelligence Feeds
When choosing a threat intelligence feed provider, there are 4 key points you’ll want to evaluate:
Point 1: Feed quality
Looking just at the sheer number of indicators won’t tell you about the data’s quality — there could be many duplicates. Instead, focus on the purity of the data. Randomly sample some indicators and assess them for false positives. High quality feeds should be highly accurate.
Point 2. Feed structure
While many vendors can provide basic indicators like malicious IPs and hashes, getting the full context around those indicators is more valuable but less common. Important context includes timestamps, and attribution details. For example, if an IP is linked to command-and-control, which malware family is it associated with? Whether a provider can deliver this information or not depends on how they pre-process indicators.
Read how we pre-process IOCs for threat intelligence feeds.
Point 3. Data relevancy
Know how frequently the feed is updated with new data, and what the typical lag is between an indicator being detected and appearing in the feed. With open-source feeds, this lag could be weeks.
ANY.RUN’s feeds get constant updates from the 400,000 analysts and 3,000 enterprise customers actively analyzing the latest malware in our sandbox. This ensures a constant stream of fresh, relevant threat data.
Point 4. Data enrichment
Basic indicator feeds have limitations. Richer context like command lines, processes, and full TTPs provide deeper understanding but are difficult to include. Nested data structures or external object references enable this enrichment.
ANY.RUN feeds include URLs to the full sandbox analysis sessions where each indicator was observed. Here’s how it looks like in the feed:
"extensions":{"author":"ANY.RUN","source_ref":["https://app.any.run/tasks/70a90108-3593-47fa-ac10-c3598421f653", "https://app.any.run/tasks/473dd5f4-a977-453f-b354-7d8b1e17aa79", "https://app.any.run/tasks/4e8d82ad-2d63-4b50-abe7-d51139f63c6f"]} You can then use several ways to pull deep data from tasks and enrich indicators with it:
- Directly through our sandbox API.
- Through OpenCTI integration.
How to evaluate feed quality
Evaluating the quality of threat intelligence data is a non-trivial task that requires tracking various metrics over time. Here are a few key measures worth paying attention to:
- Lack of false positives. for example, you might get an IP indicator with a value 8.8.8.8.8 in a feed — this is a Google.com address. It could get there by accident or as a result of some malware connecting to Google to probe the network. In a useful feed, all IOCs should be meaningful and related to real threats.
- Indicator age: Are you receiving indicators for the latest threats in a timely manner? Or is there a lag where you’re only seeing old indicators long after the fact? Fresher is always better for defensive purposes.
- Rate of new data arrivals: What percentage of indicators in each new feed upload are brand new, versus updates to existing ones? A high rate of truly new indicators signals a feed with constantly fresh intelligence.
- Distribution of indicator types: Do certain IOC types like IPs, domains, hashes, predominate in the feed? Understanding the indicator mix can help optimize how you operationalize the data. For example, IP-heavy feeds are great for tuning web application firewalls, while hash-heavy feeds are ideal for endpoint protection.
- Average indicator lifetime: How frequently does the source update their existing indicators? This metric looks at the difference between an indicator’s created and last-modified timestamps to gauge update cadence.
What are threat intelligence feeds: summary
Threat intelligence feeds are streams of data that contain indicators of compromise such as malicious IP addresses, domains, file hashes and associated context. They help security teams improve detection of new threats as soon as information on them becomes available and overall — enhance cybersecurity. On the subscriber side, feeds are typically integrated into SIEM and TIP systems. Overall, the indicators they provide are used to configure security systems such as WAFs and EDRs.
About ANY.RUN
ANY.RUN’s flagship product is an interactive malware sandbox that helps security teams efficiently analyze malware.
Every day, a community of 400,000 analysts and 3000 corporate clients use our cloud-based platform to analyze Windows and Linux threats.
Key advantages of ANY.RUN for businesses:
- Interactive analysis: Analysts can “play with the sample” in a VM to learn more about its behavior.
- Fast and easy configuration. Launch VMs with different configurations in a matter of seconds.
- Fast detection: Detects malware within roughly 40 seconds of uploading a file.
- Cloud-based solution eliminates setup and maintenance costs.
- Intuitive interface: Enables even junior SOC analysts to conduct malware analysis.
Learn how ANY.RUN can benefit you or your security team. Schedule a free demo with one of our sales representatives, and we’ll walk you through real-world examples.


0 comments