


At ANY.RUN, we’re all about making in-depth technical information accessible. One of the ways we do this is by providing you with various detailed, yet easy-to-understand reports on malware behavior. One such report is Process graph.
What is Process graph?
Process graph is a report that visually shows how system processes, especially malicious ones, relate to each other.
In this article, we’ll explore:
- How this small but very powerful ANY.RUN feature works.
- How to access it.
- And when you might find it useful.
How to access the Process graph report?
Process graph is one of our users’ favorite features. Let’s walk through how to open this report using this analysis session recording as an example.
☝️ To access all session reports, complete your analysis session first.
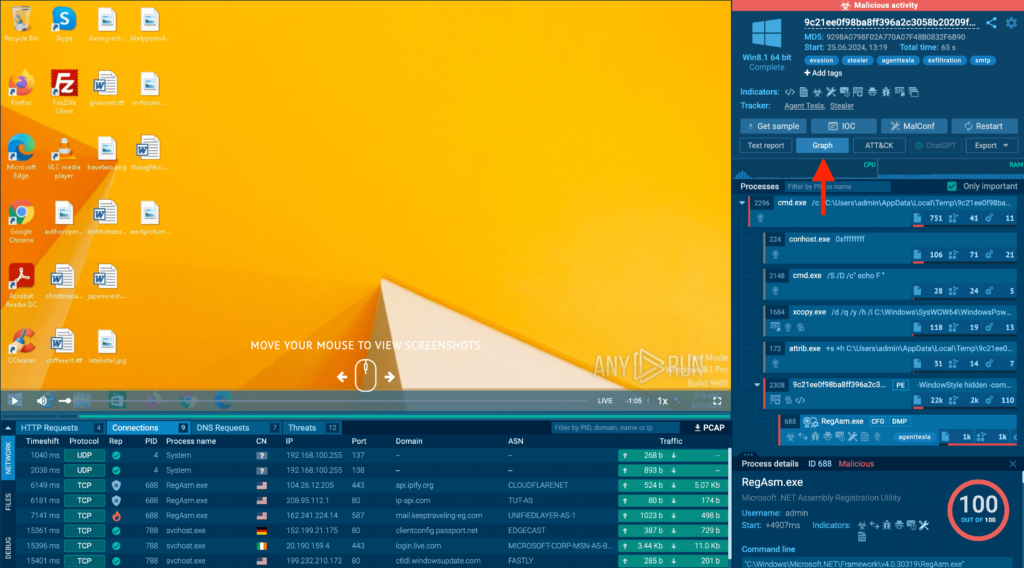
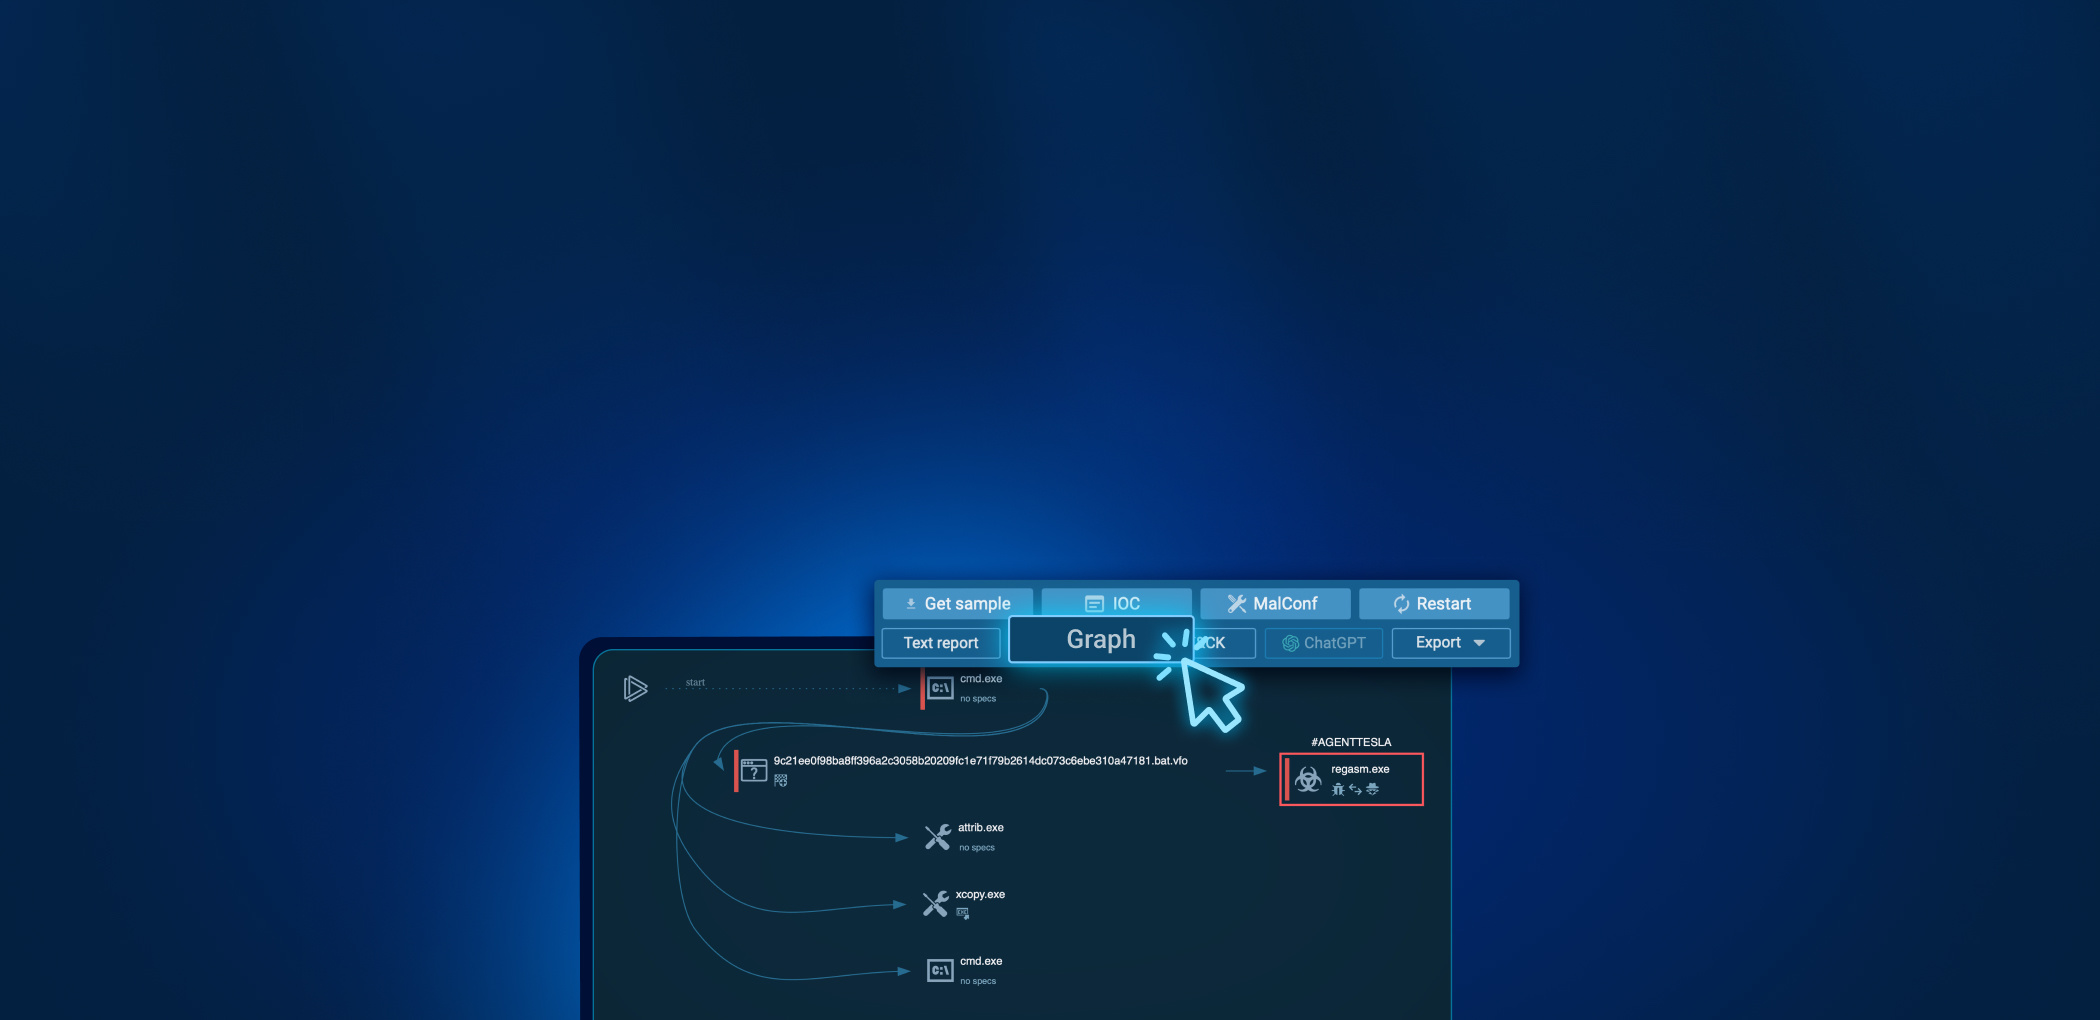
To open the graph, click on the Graph button in the top-right corner of the screen.
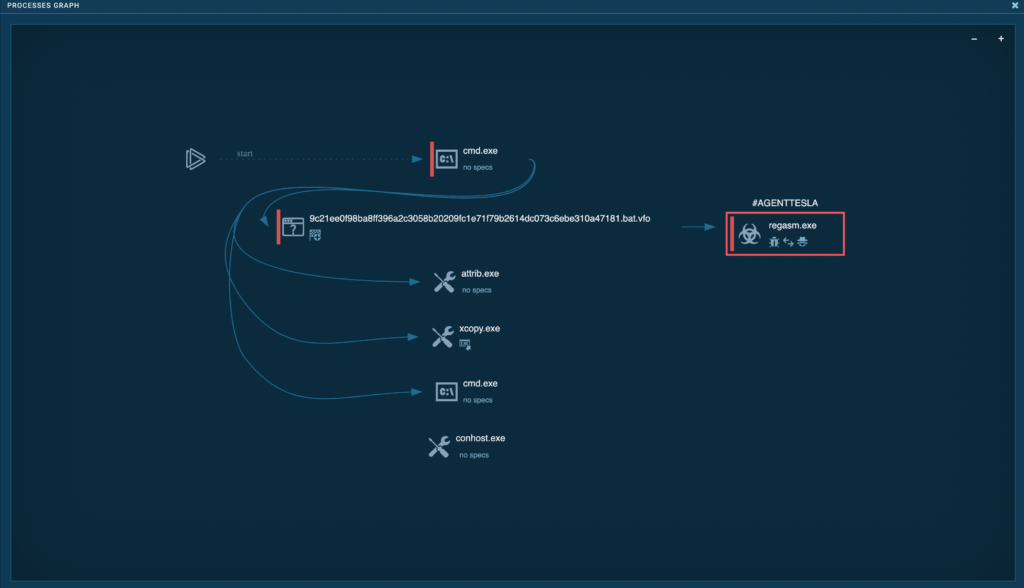
A new full-screen popup will open, showing you a visual representation of system processes on a canvas.
This view makes it a lot easier to see how processes relate to one another and trace parent-child relationships.
What can you do in Process graph?
Process graph has some hidden features!
Firstly, it is a fully interactive visual representation of the same information you see in the Process tree. And just like in the tree, you can access additional data by clicking on each process:
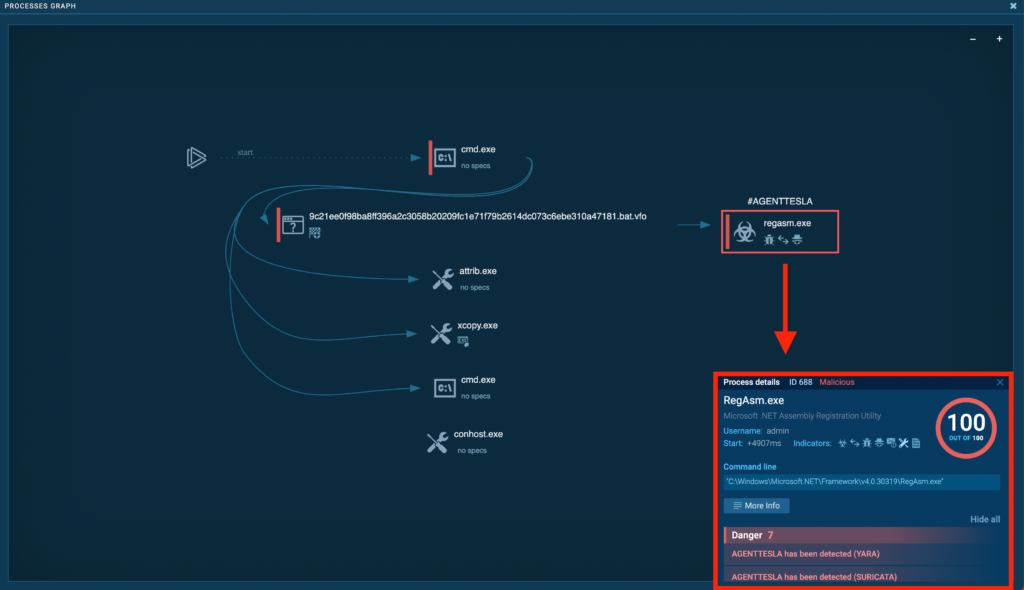
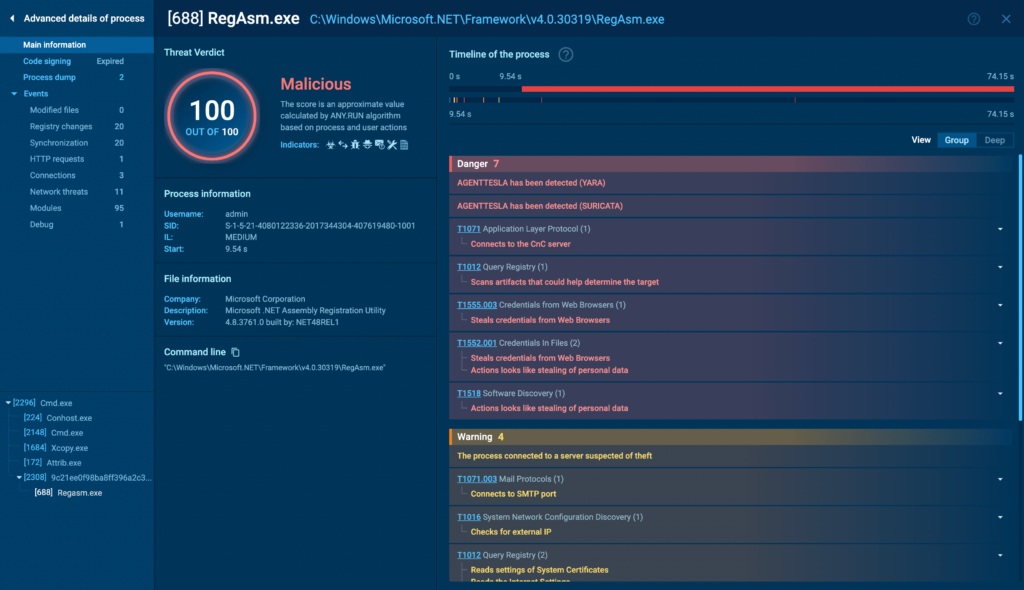
Clicking on a process (like the one marked with #AGENTTESLA) reveals extra information in a popup, including:
- Malicious score.
- Expanded list of indicators.
- Related command line.
- Triggered signatures with descriptions.
By clicking More info, you can access Advanced process details for an even more in-depth report:
Secondly, you can move around the canvas and zoom in and out.
In our first example, all the information fits in one screen, but we’ll see this aspect better used in the next example.
When might you use the Process graph report?
Process graph is particularly useful when you’re working with a sample that has many nested or branching processes, making it difficult to identify the main one from a vertical process tree.
In other words, it’s most helpful when a linear tree view seems overwhelming or confusing due to malware launching lots of child processes to mislead analysts.
Let’s see this in action! Consider this TrickBot sample:
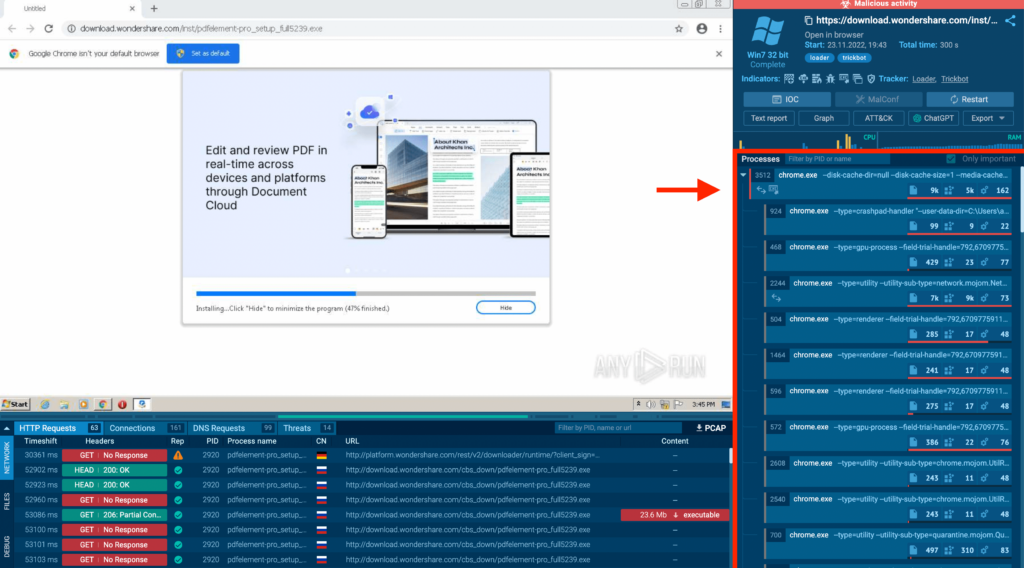
In this analysis session, the list of processes goes on and on, and there’s a long scrollbar. Let’s switch to the graph view to make sense of this complexity:
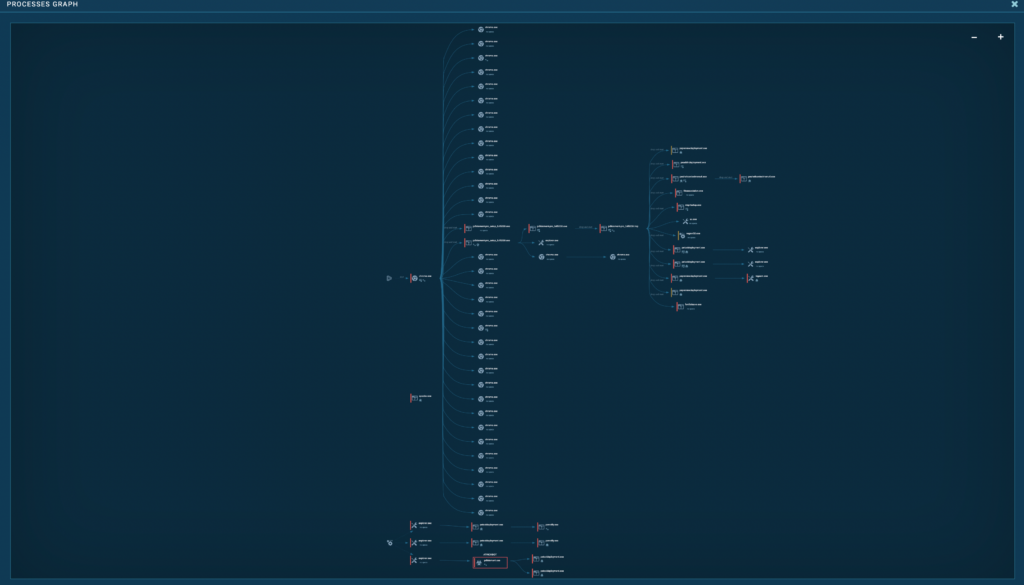
Now it becomes crystal-clear which processes are parents, which are children, and how they branch out.
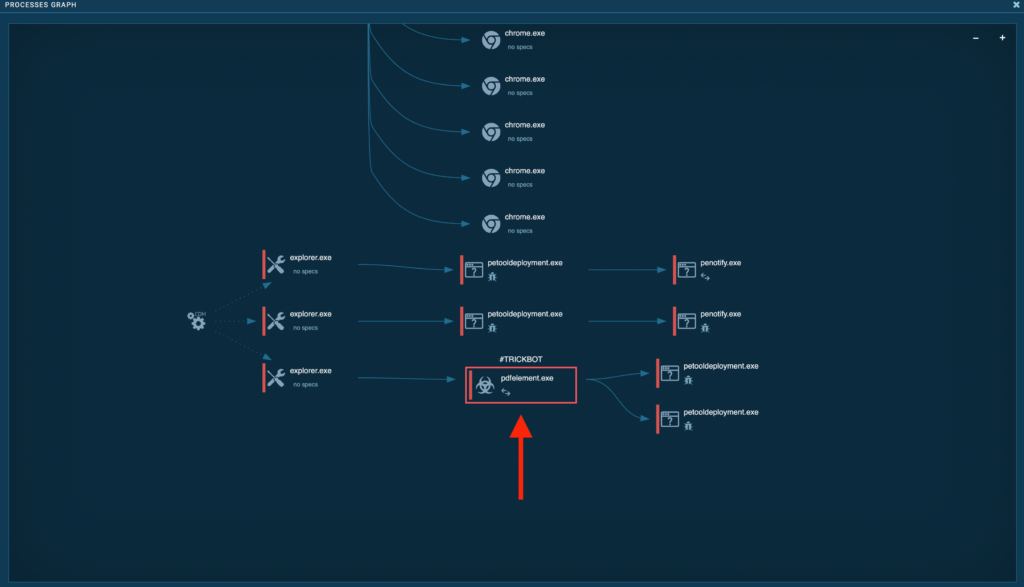
From here, you can easily trace your way to the main executable, which is in this group:
To summarize
Let’s quickly recap:
- Process graph visually represents relationships between system processes, especially malicious ones.
- It’s interactive and you can click on processes to see additional details, including malicious scores, indicators, and triggered signatures.
- Process graphs are particularly useful for complex malware samples with many nested processes, where linear tree views become confusing.
- The graph view makes it easier to identify parent-child relationships and trace the main executable in complex scenarios.
About ANY.RUN
ANY.RUN helps more than 400,000 cybersecurity professionals worldwide. Our interactive sandbox simplifies malware analysis of threats that target both Windows and Linux systems. Our threat intelligence products, TI Lookup, Yara Search and Feeds, help you find IOCs or files to learn more about the threats and respond to incidents faster.
With ANY.RUN you can:
- Detect malware in seconds.
- Interact with samples in real time.
- Save time and money on sandbox setup and maintenance
- Record and study all aspects of malware behavior.
- Collaborate with your team
- Scale as you need.


0 comments