


Welcome to the ANY.RUN community! You have decided to use our service, already registered but still, a bit confused about how ANY.RUN works and what to do here? No worries! This crash course will give you the whole picture of ANY.RUN functionalities and features. So, let’s get started.
What is ANY.RUN?
ANY.RUN is an interactive malware analysis sandbox. All cybersecurity specialists can use the platform from students to experts. The service detects, analyzes, and monitors cybersecurity threats. A user-friendly interface allows performing effective and qualitative investigations.
ANY.RUN company was founded in 2016. Since that time, it has held a leading position among platforms that detect malicious programs. 150k malware analytics work with the service every day. And a lot of users benefit from the platform’s results of the investigation. Large companies from finance, healthcare, trading, and many other sectors use ANY.RUN and keep their data safe.
The service shows all processes in real-time. And an analyst can notice all malicious operations before the final version of the report.
Besides that, our community has numerous investigators all over the world who take part in our threat intelligence platform. ANY.RUN comprises over 2 million public submissions and this vast malware database is updated daily. Users can collect new samples and IOCs using this database. You can work individually or in a team. Tasks that you create may be public or private. The advantage is that you can save your money using ANY.RUN instead of wasting it on extra equipment and useless tools.

Unlock all ANY.RUN features
Launch Windows 11 VMs in 32 and 64-bit versions, and create private tasks with longer timeout.
Try it free for 14 days.
Interface and service overview
Dashboard
Here you can find ANY.RUN’s dashboard. Let’s get acquainted with it a little closer. There is a fixed map of downloaded malicious programs in real-time on the main page. The top 5 countries with the most malware samples are here. The total volume of IOCs and analysis time on the service is placed in the middle. Below that, we have the change log that gives you information about the updates to the site. On the right you can find statistics for the last 24 hours: you see an interesting sample, the number of tasks that are run right now, the total amount of submissions, and the task ratio. Some uploaded samples that were recently added by users are at the bottom right. Information monitoring is always in real-time and up-to-date.
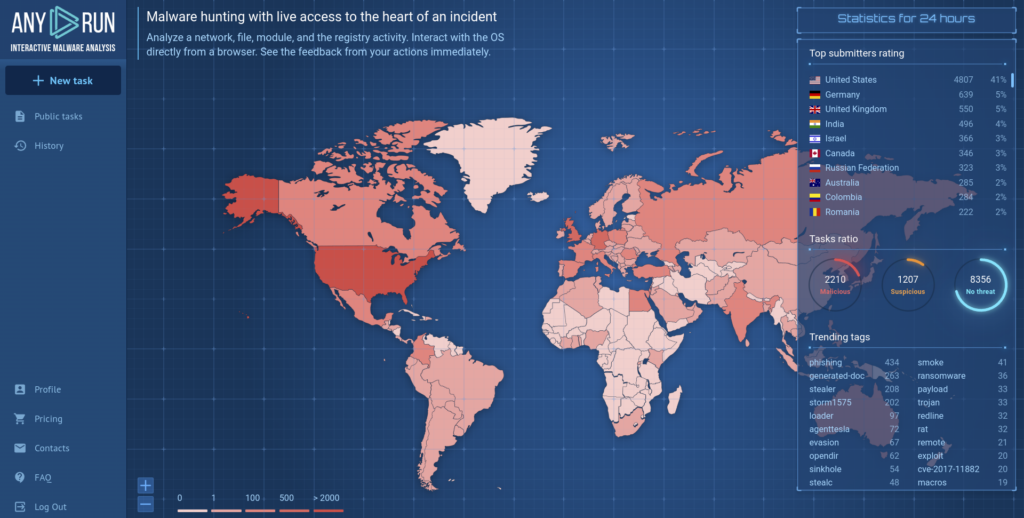
There is a functional menu on the left to demonstrate the latest launched tasks and public submissions. To submit a sample on the analysis, press the “New task” button on the upper part of this section. Account settings, information about plans, FAQ, and support is also here. If you are a part of a research group, you’ll have a team history with your colleagues’ tasks.
Profile
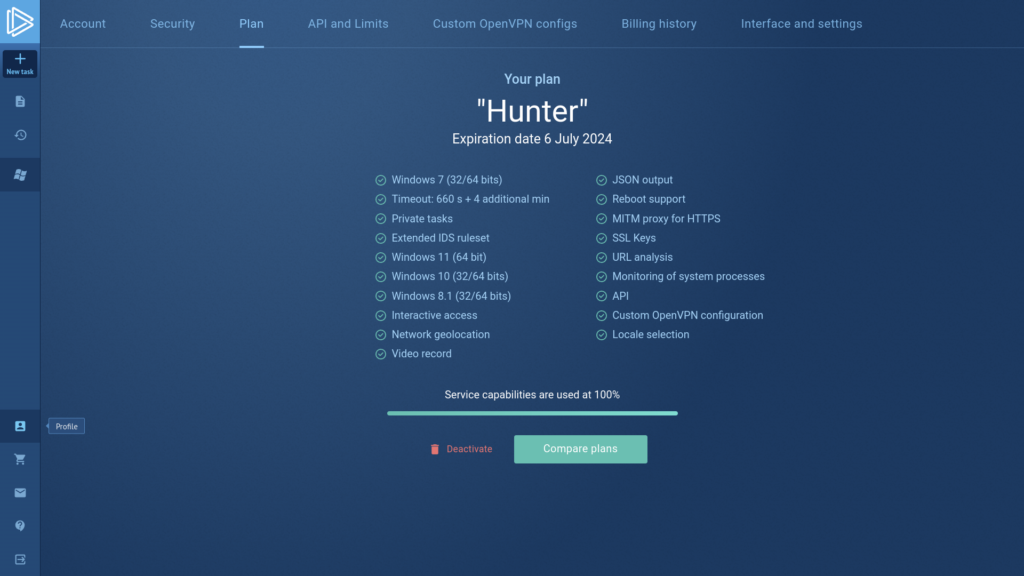
One of the tags in the functional menu leads you to the profile window. All details about your activity in the service are there:
- An option to upgrade your plan and look through the current one’s features;
- All profile information;
- Overview of your API and limits (for Enterprise Suite users);
- Changing the OpenVPN configurations;
- Teamwork management (for Enterprise Suite users);
- Information about your payments;
- Altering the default settings and interface.
Public submissions
The major reasons you come to our service are to run a task and get acquainted with public samples. If you would like to know how to analyze a suspicious file in ANY.RUN, check out this article. And now let’s have a look at the “Public tasks” tag.
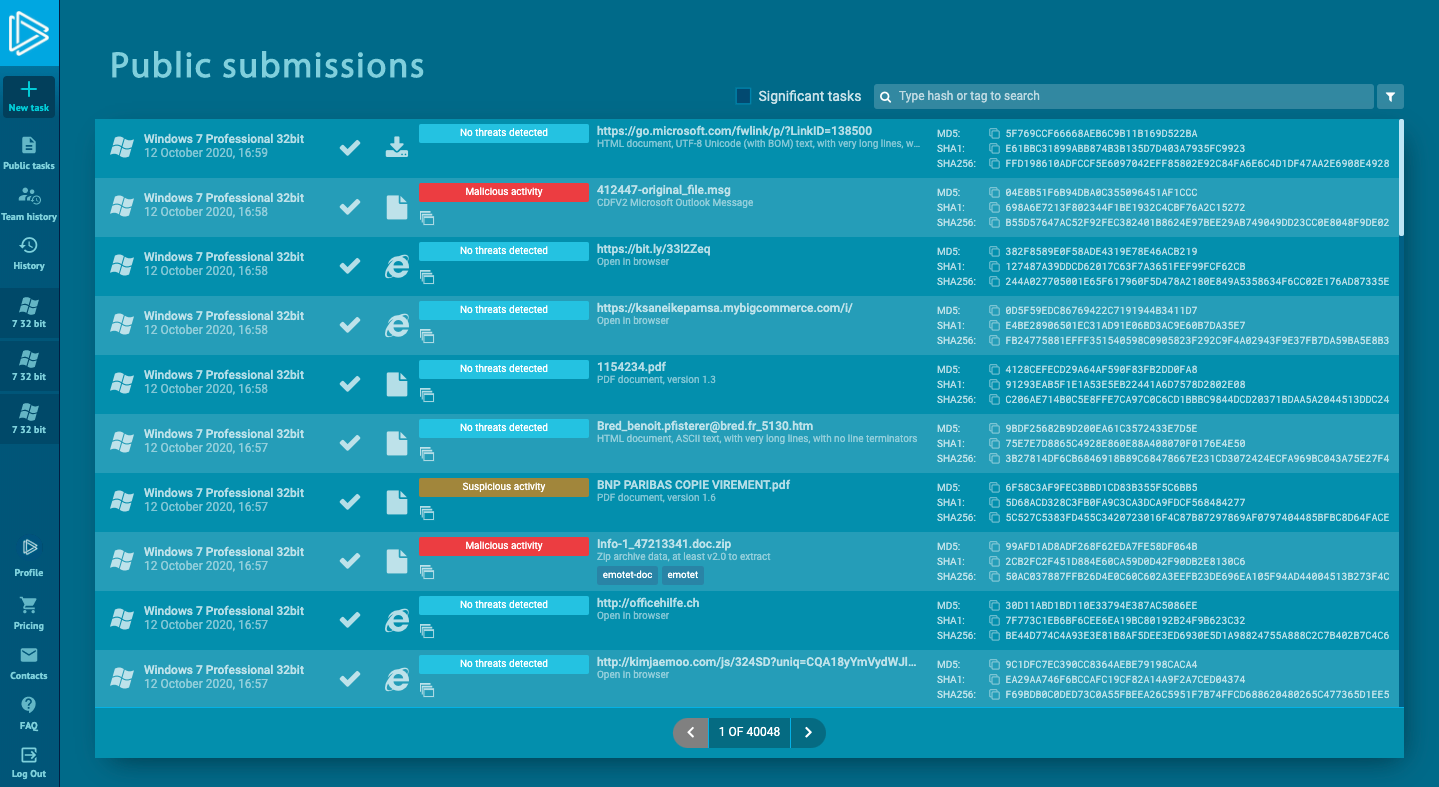
The tasks can be both private and public. Here you can go through all the tasks that service users upload publicly. Now ANY.RUN provides a vast database with over 2 M samples.
ANY.RUN is a service for deep malware analysis, besides that, it is an excellent platform for education. The “Public tasks” window is the place where users share their investigations. It helps to investigate samples and collect IOCs. A detailed report will help you find the necessary information quickly and export it.
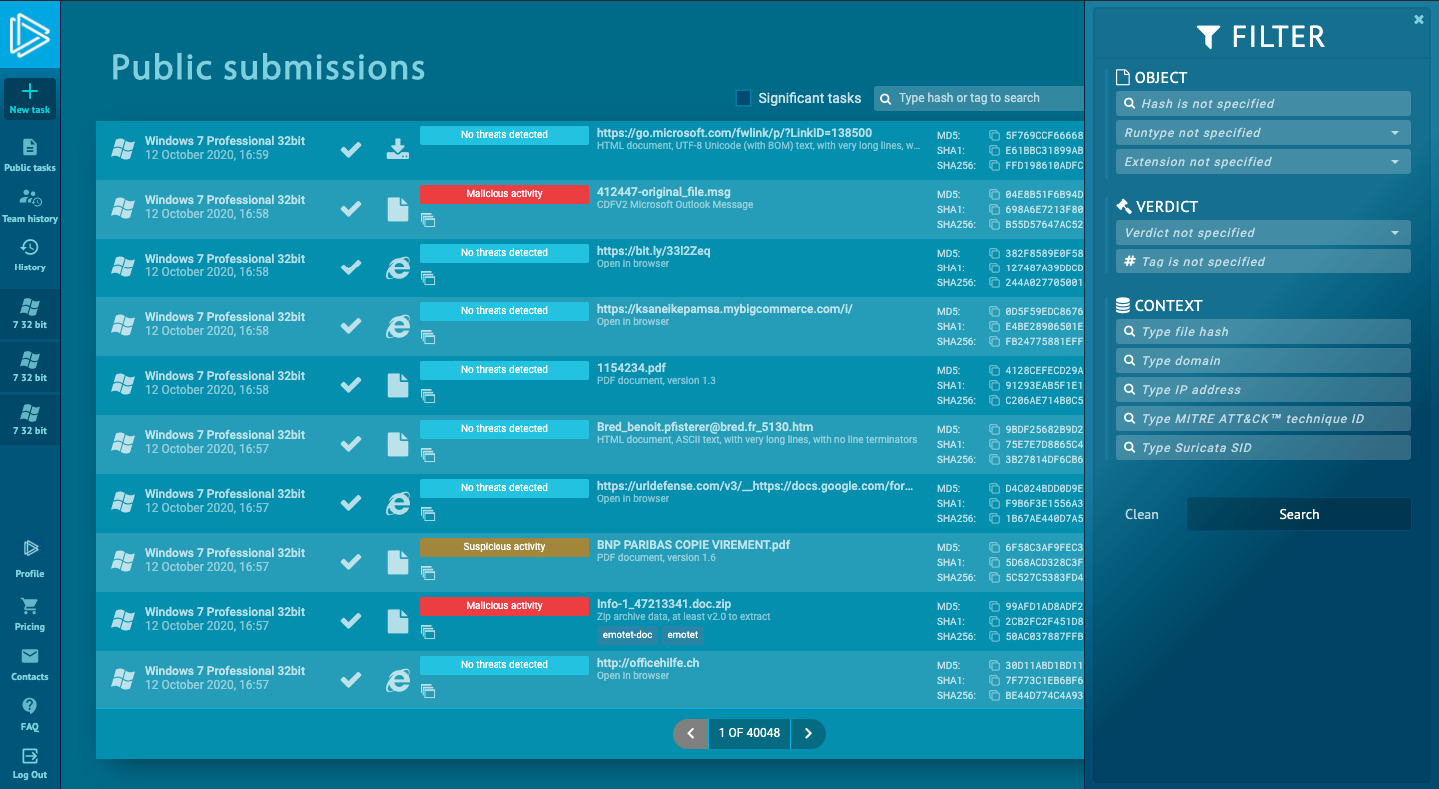
There is a convenient filter system in the public submissions by a hash, a run type of analyzed object (URL or file), a verdict, extensions, specified tags. In the unique context part, you can fill information about the hash type, domain type, IP address type, Mitre attack type, and Suricata SID type. It is possible to configure components by one or several parameters. You get an opportunity to use the service for Open-source intelligence, OSINT. If you have a potentially infected IOC, you need to filter it and find tasks with similar examples.
After analysis, each task gets a “Verdict” of the sample’s threat level. You can also filter tasks using the status.
There are three types of Verdicts:
- “Malicious”: malicious activity is detected;
- “Suspicious”: suspicious activity was detected and there is a possibility of the file to be malicious but it isn’t proved;
- “No threats detected”: ANY.RUN has detected no malicious or suspicious activity.
If you click on a public task, it opens in the next tag. You see the results of analysis immediately as well as visual analyses in form of a video or a screenshot slideshow.
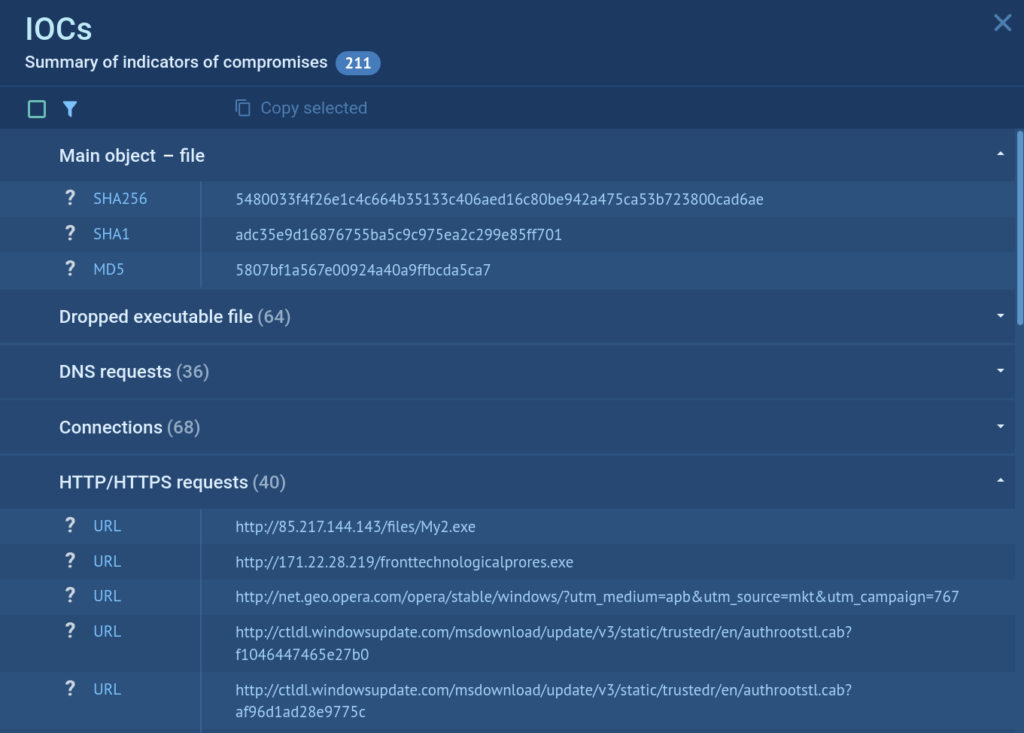
The analysis reports are convenient – the most important information is at the top, so you won’t miss a thing. A report contains the final verdict, a summary of indicators of compromises, the process behavior graph, etc.
Configuration change
You can also rerun a task and watch the process personally. With the Hunter plan, you get extra functionality: change necessary configurations and see how malware acts on virtual machines with different operating systems. At the same time, there is no need to download a suspicious file on your computer and put it at risk.
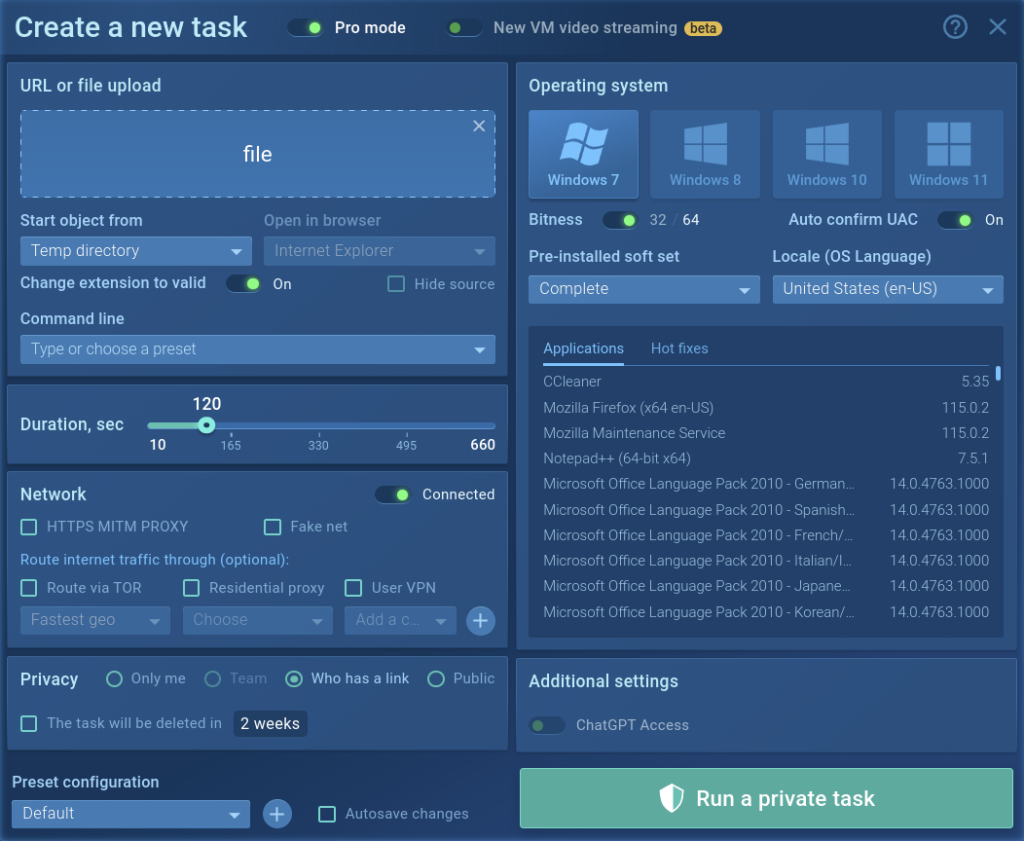
While rerunning a task, the parameters set by an analytic and owner of the task are set by default. You change them to see how the task acts with other configurations.
You can choose the version of the operating system from Windows (7, 10, 11), Linux (Ubuntu 22.04.2), or Android, interface language, 32bit or 64bit.
Use different options for the flexible configuration of a virtual system. If you need additional software installed in your VM, choose the Development soft set. It provides tools like Python, x64bg, Wireshark PE, and more for analysis of complex threats. It is possible to save settings as a configuration by default if you need it.
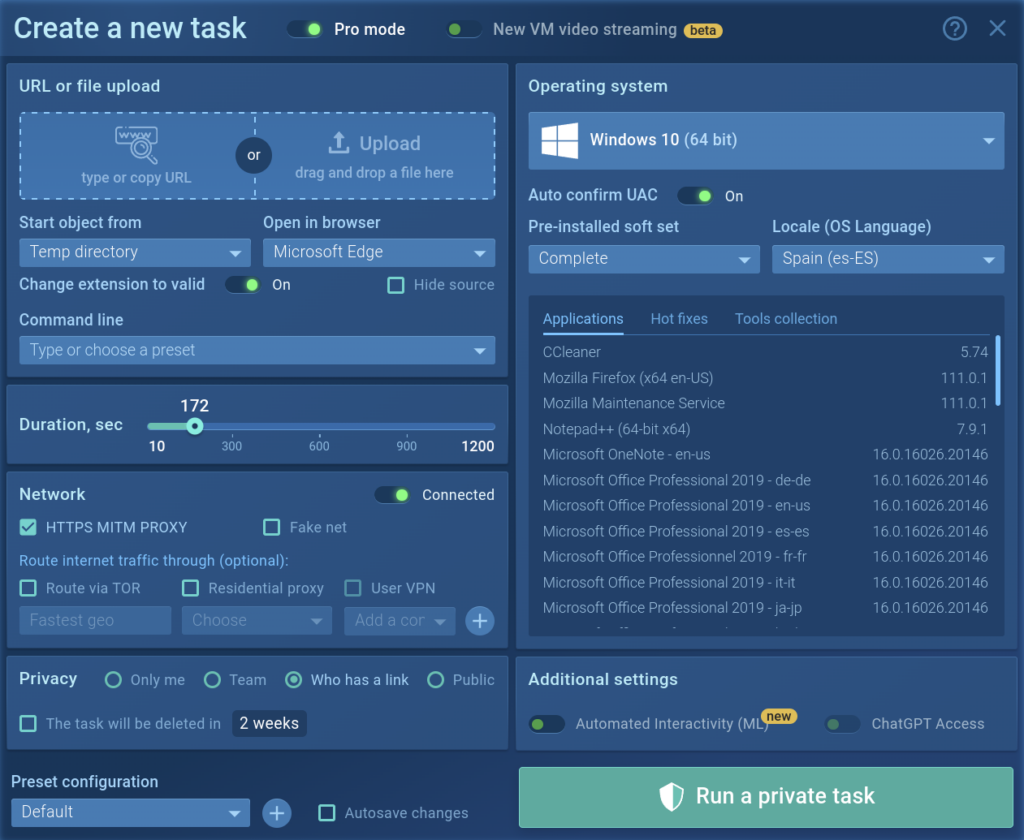
In the picture above you can see that we chose Windows 10, Spain language, and increased the time of process duration up to 172 seconds instead of the standard 60 seconds. We also noted HTTPS MITM proxy.
Let us show you how ANY.RUN can help your SOC team – book a call with us ⬇️
Task window
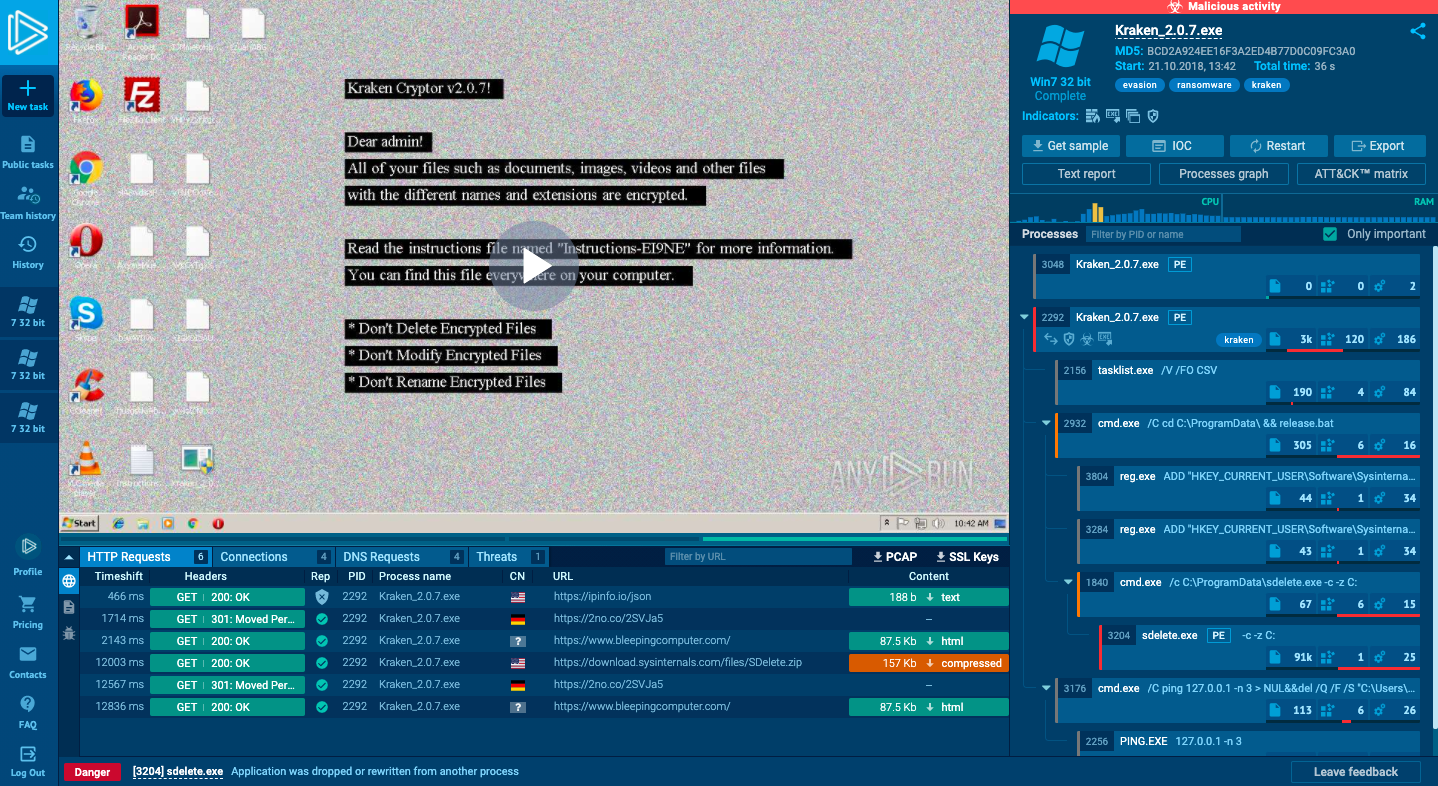
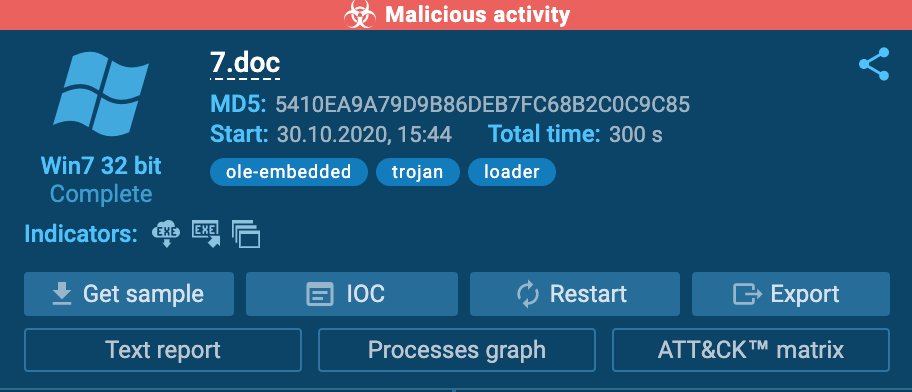
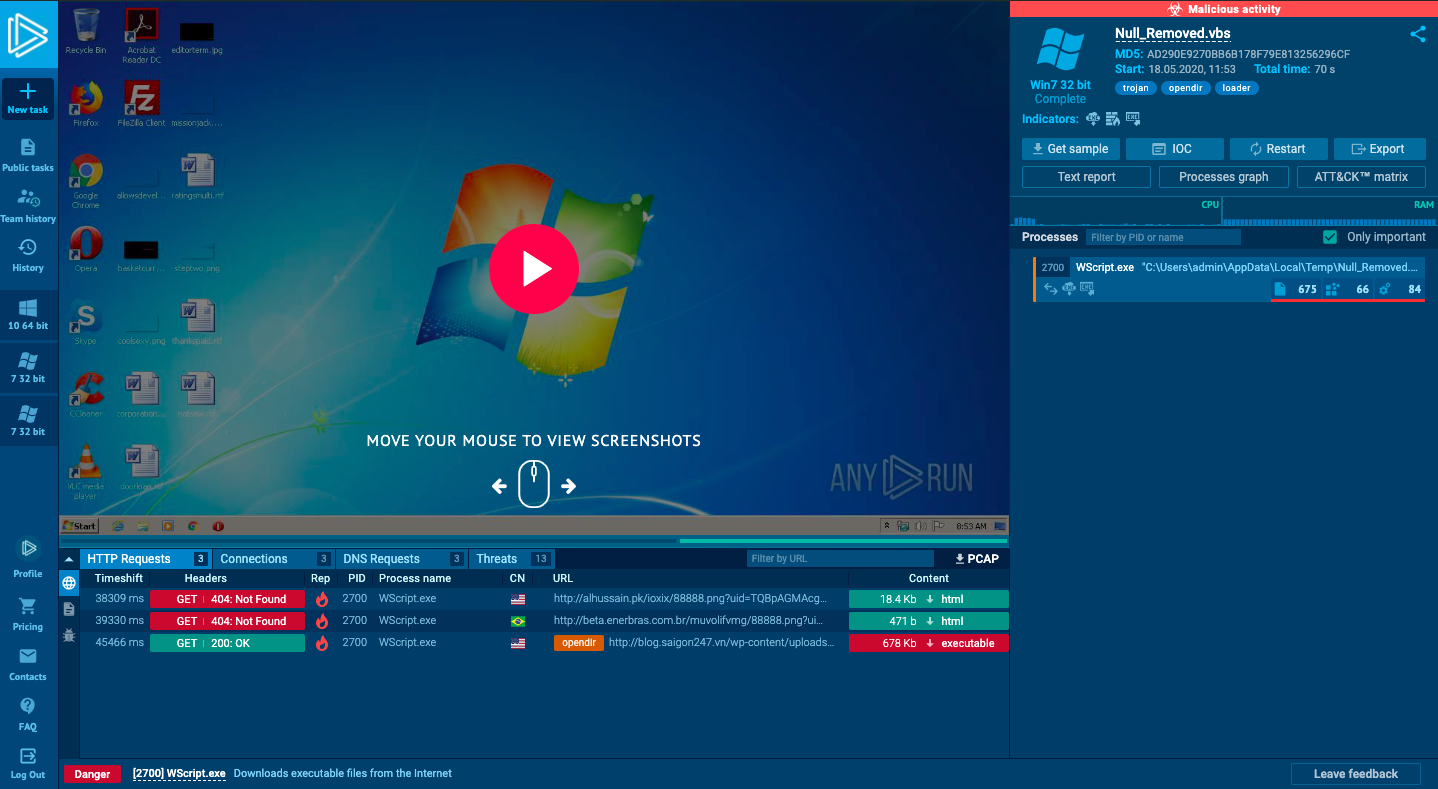
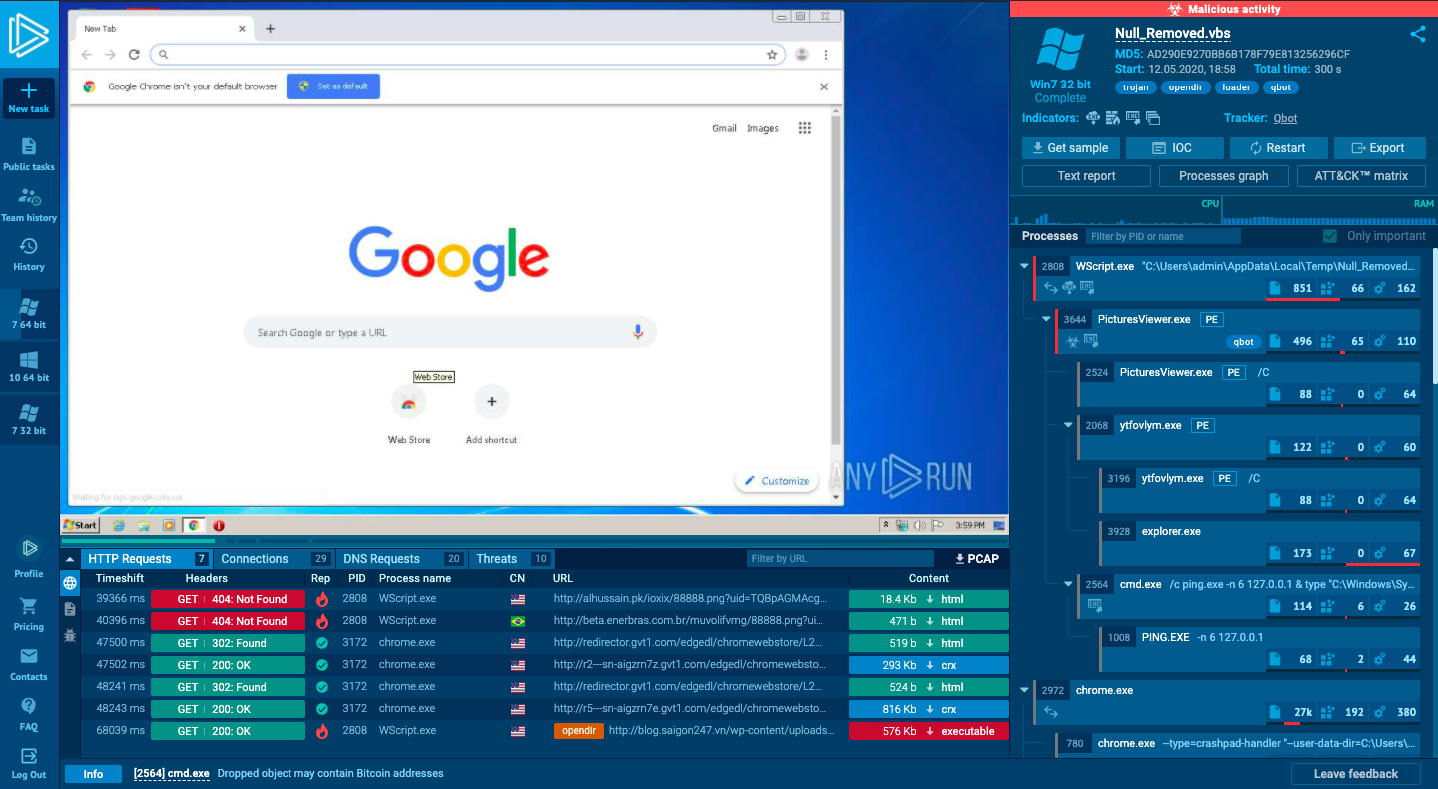
We’ve already mentioned what is waiting for you during the analysis. Let’s have a closer look at the interface. The task window provides you with every piece of information available about the current task (either working or finished).
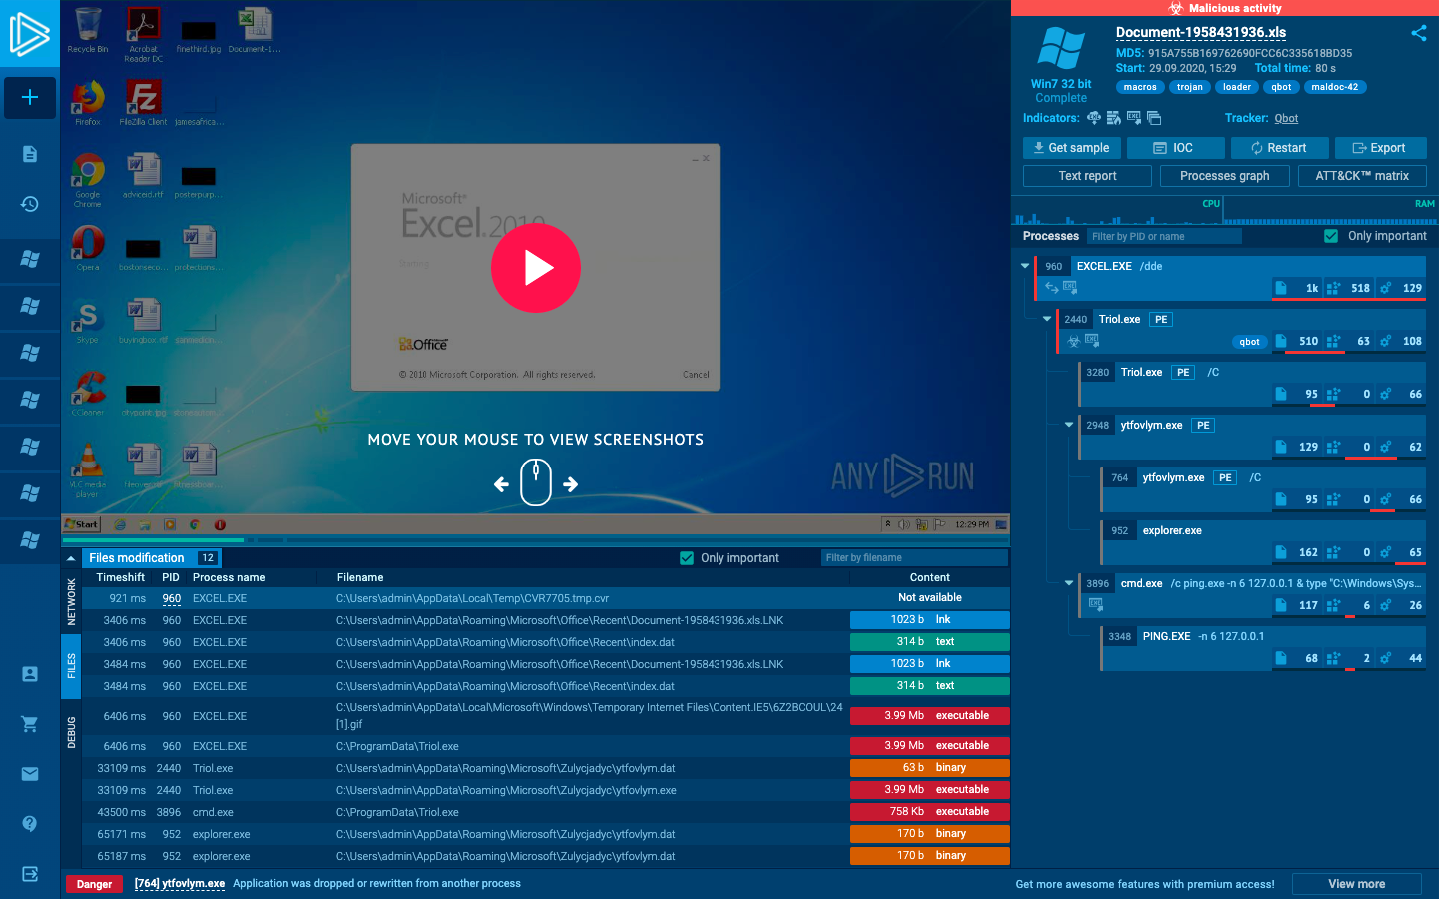
Info block contains information about your task: the name of the submitted file of the URL address, date and time, tags, indicators, the tracker, OS version, and its environment. From the Info block, users also download the submitted sample, IOCs, restart the task, and can get access to “Process graph”, “Text report” and “ATT&CK Matrix”. There you can also export “JSON Summary”, “JSON IOC”, “HTML Document”, “Export Process Graph (SVG)” and “JSON MISP format”.
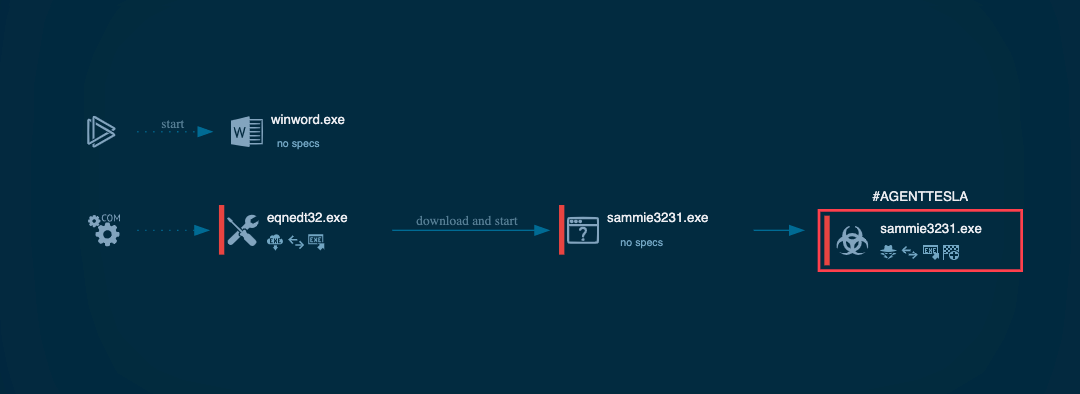
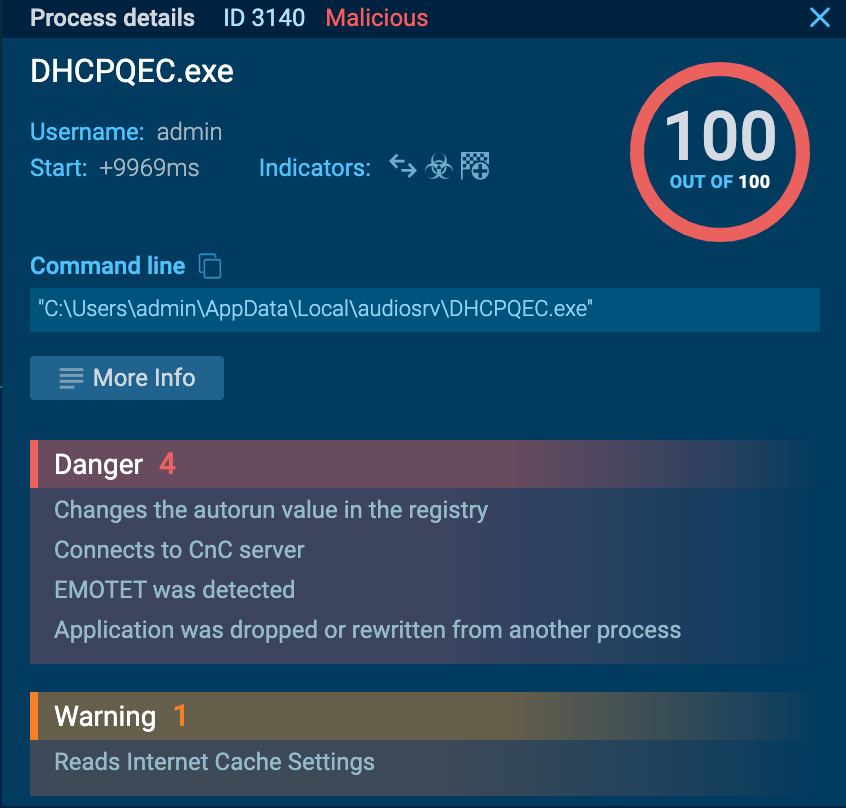
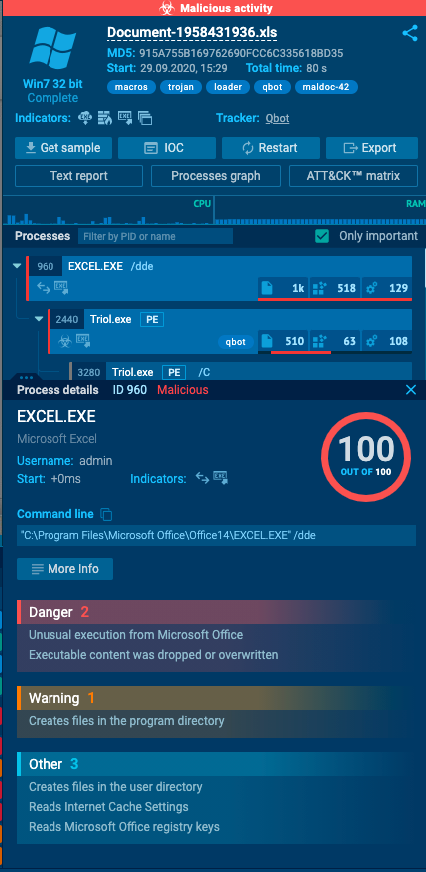
By clicking on the “Process graph” button, you open the graph where all the processes are shown conveniently. Under all processes, indicators are presented, which give an idea about the activity of the specific process. If you want to know more about a particular process, just click on it and the “Process details” window shows up.
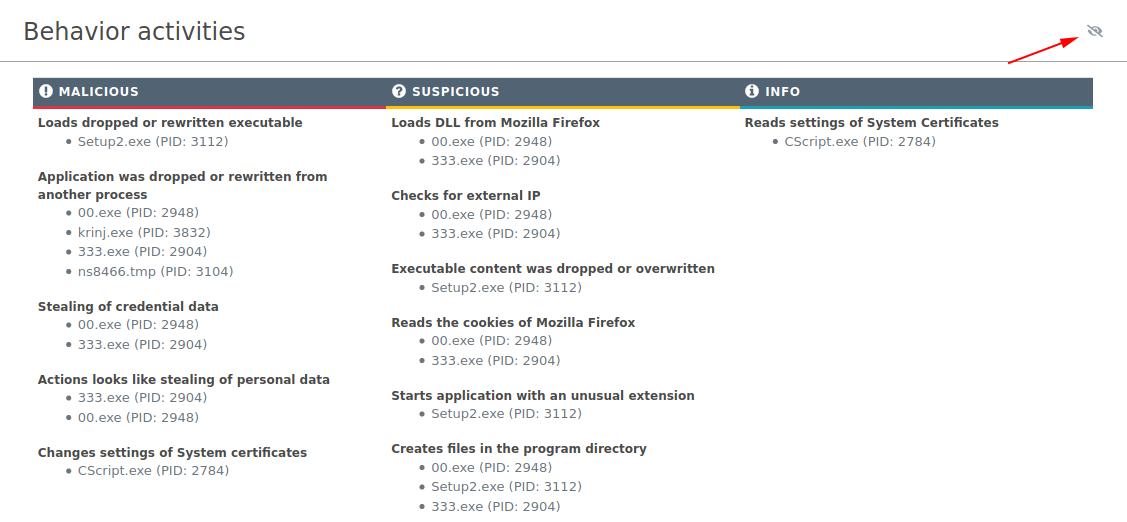
“Text report” feature exports information about all activities in the task in the form of an HTML file. Note that you can exclude blocks from the report by clicking on the “eye” icon on the upper-right corner of this block.
On the right of the analysis interface, the process tree is demonstrated. You get a logical process structure and all necessary information about the processes on one page. Besides that, if you click on the process, the ‘Process details’ window opens.
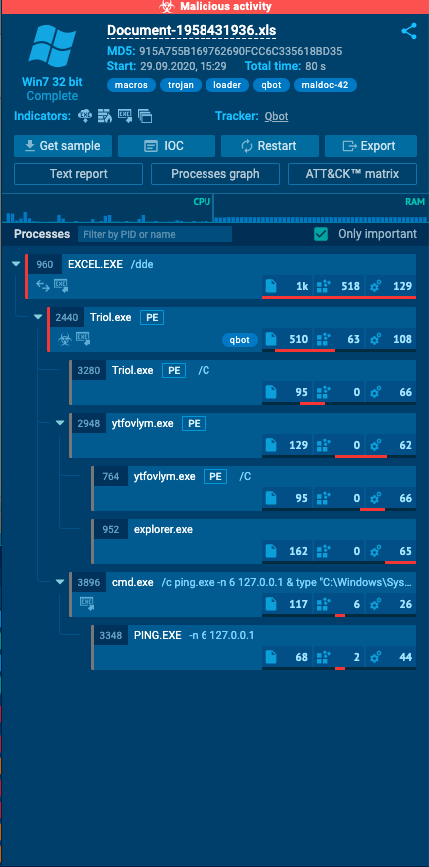
Visual analysis in the form of a video or a screenshot slideshow is displayed in the middle.
A detailed analysis of the process is shown below. Three blocks give full information:
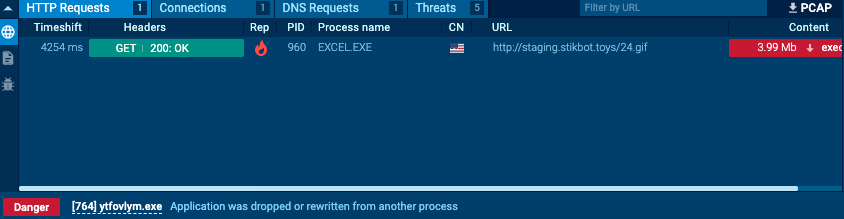
1. The “Network” block tells information about the exchange of malware packages in “HTTP Requests”, “Connections”, “DNS Requests”, and “Threats”. Copy what you need in the “Request details” window.
- The “HTTP Requests” section displays details of the connection requests. You can see the response of the URL connection with the content. Filter by URL is available.
- The “Connections” section demonstrates other protocols that were not mentioned in “HTTP Requests”. You also get information if there is no response at all. The content of the packages and network stream is useful, click on “Traffic” to learn about it. Download extended data in PCAP and open in any other services. Filter by IP is available.
- The “DNS Requests” section is needed to show the correlation between a domain name and IP address. The status reflects whether it was successful or not: Responded or Requested. Filter by IP or domain is available.
- The “Threats” section detects intrusion in the systems owing to the Suricata rules. Malware is stated and the task is tagged. All information about suspicious activities will be here. Filter by a message is available.
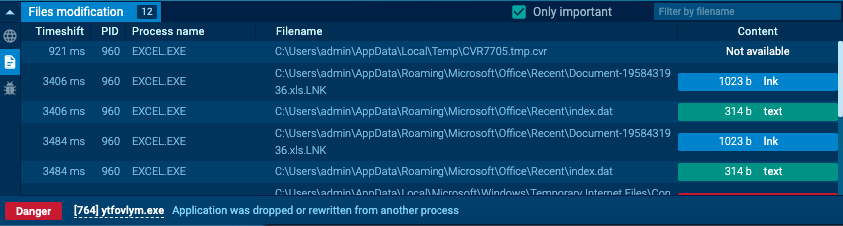
2. The “Files modification” block notes every file that was created by all processes. You can copy filenames and download “Static Discovering” information by clicking on “Content”.
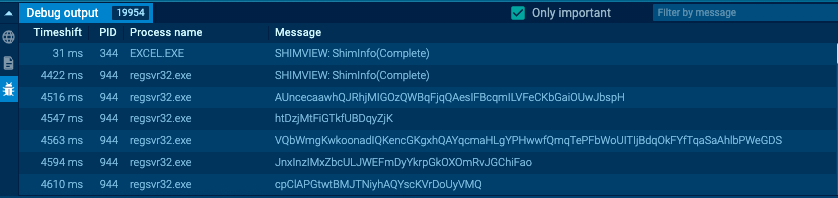
3. The “Debug output” block gives extra information on how to debug the program afterward. If malware such as Dridex has debug output messages, they are going to be cited in this block.
A use case from ANY.RUN
From time to time, we face samples that have suspicious or malicious activity. Unfortunately, systems can’t identify what malware families they belong to. To find this out, you need to perform reverse engineering. But it is time-consuming and resource-intensive. ANY.RUN has a useful filter feature to make this process faster and easier.
For example, let’s have a look at the following task: https://app.any.run/tasks/c862a5eb-ae30-40ae-86d1-0744c664533b
The suspicious activity is detected, but the malware family isn’t identified, because the payload hasn’t been downloaded. One of the reasons can be that the Command & Control server is already down.
Let’s copy the first IP address that the 104.28.21.40 sample referred to. Then paste it to the search filter in the Public Submissions tab.
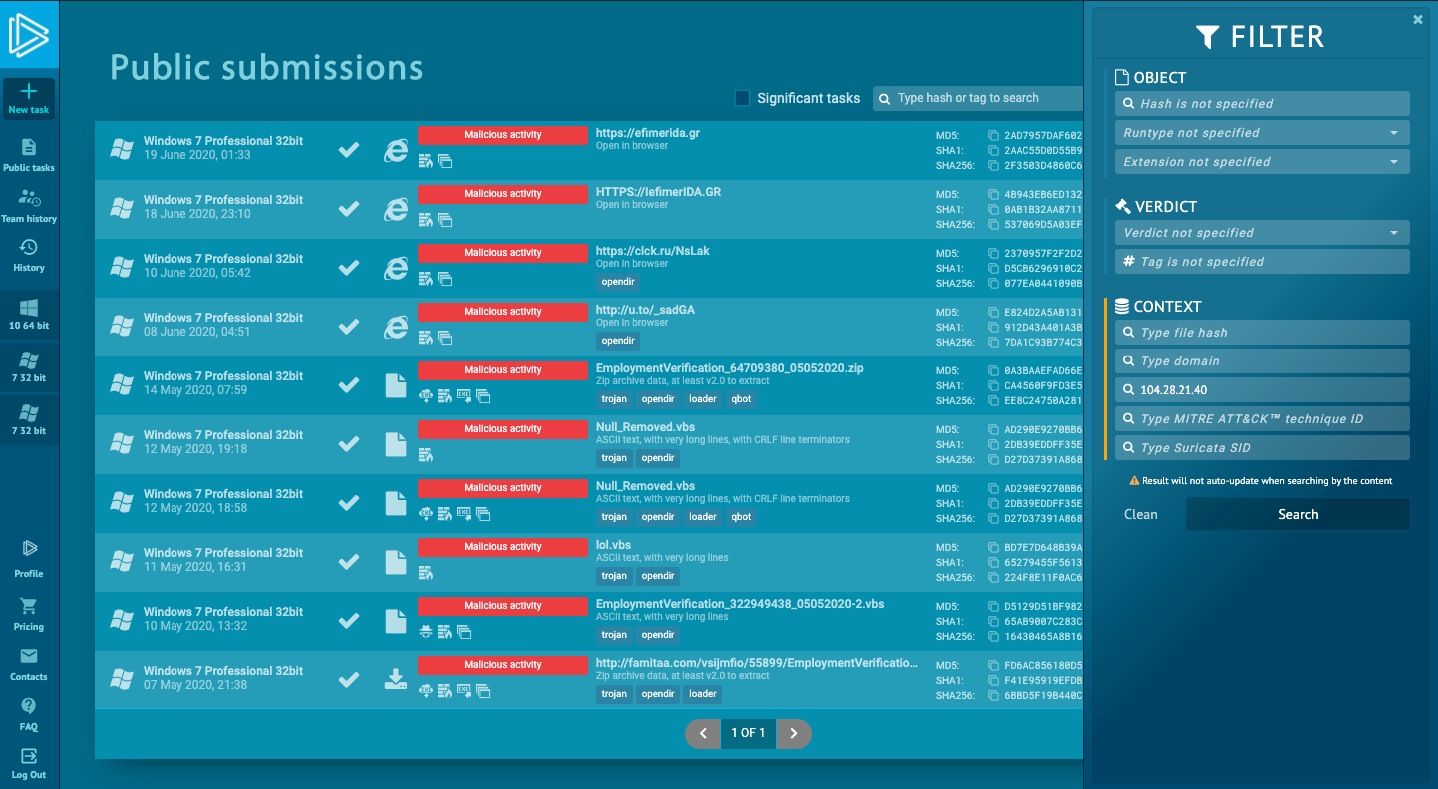
Now you see the tasks connected with the IP address. There is a similar task identified as Qbot malware.
This function will save your time and malware analyst’s resources.
Team management
Using Team management, you can work as a whole team on one sample in real-time, have a common history of tasks, keep track of what tasks your employees’ launch. And it is very convenient for training new staff. Also, the leader can manage his team subscriptions.
A company could purchase multiple licenses and distribute them to their employees. If one becomes unavailable their license can be withdrawn from that person’s account and reassigned to another one. A great way to manage dynamically changing teams.
To create or join a team is available to Enterprise Suite paid plan subscribers.
A team has its own task history that is displayed on the left side of the screen. Depending on the configuration set by the leader, tasks can be:
- All tasks of participants are available to team members;
- Only the leader’s tasks are available to team members;
- Team members can see each other, but only the leader’s tasks are available in team history via links.
Group analysis allows you to watch your department’s work and to train junior malware analysts. Also, team management is a perfect solution to finding out the productivity of your specialists. Here you can manage big and dynamic teams on the fly.
Malware Tracker
ANY.RUN is not only an interactive tool for malware analysis. It is a service for the exchange of malware data. Malware Trends Tracker shows statistics of uploaded malware according to its types over a certain period: all time, a month, 2 weeks, or the last 7 days.
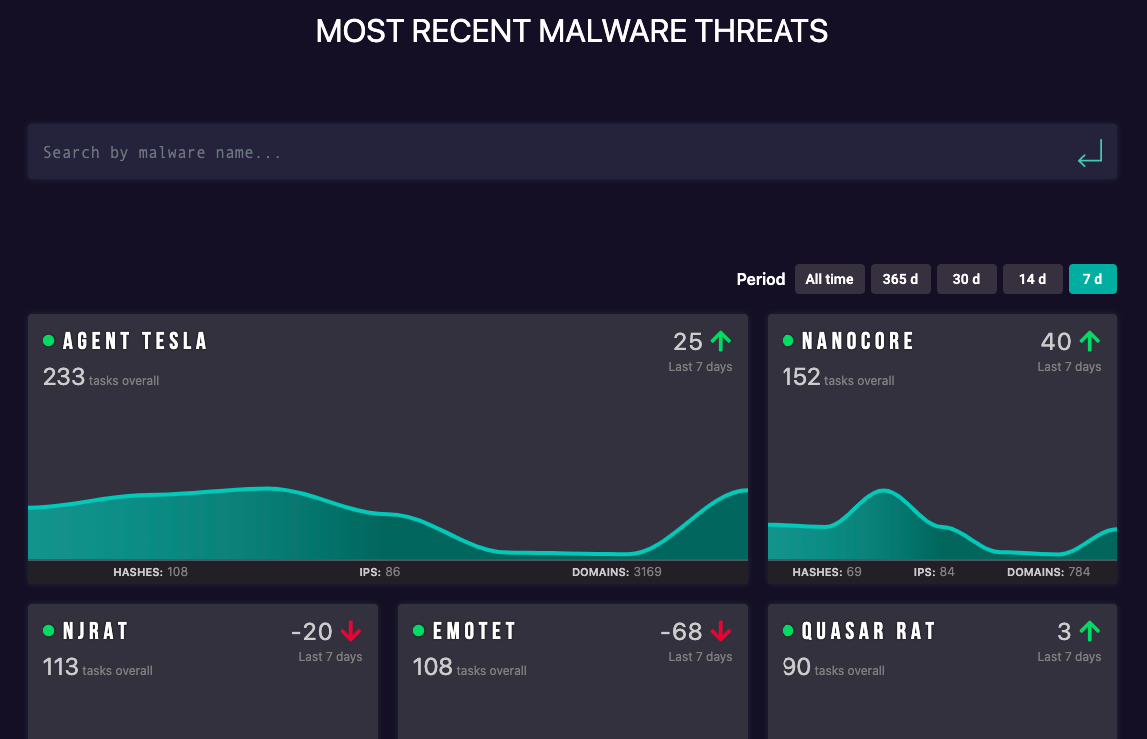
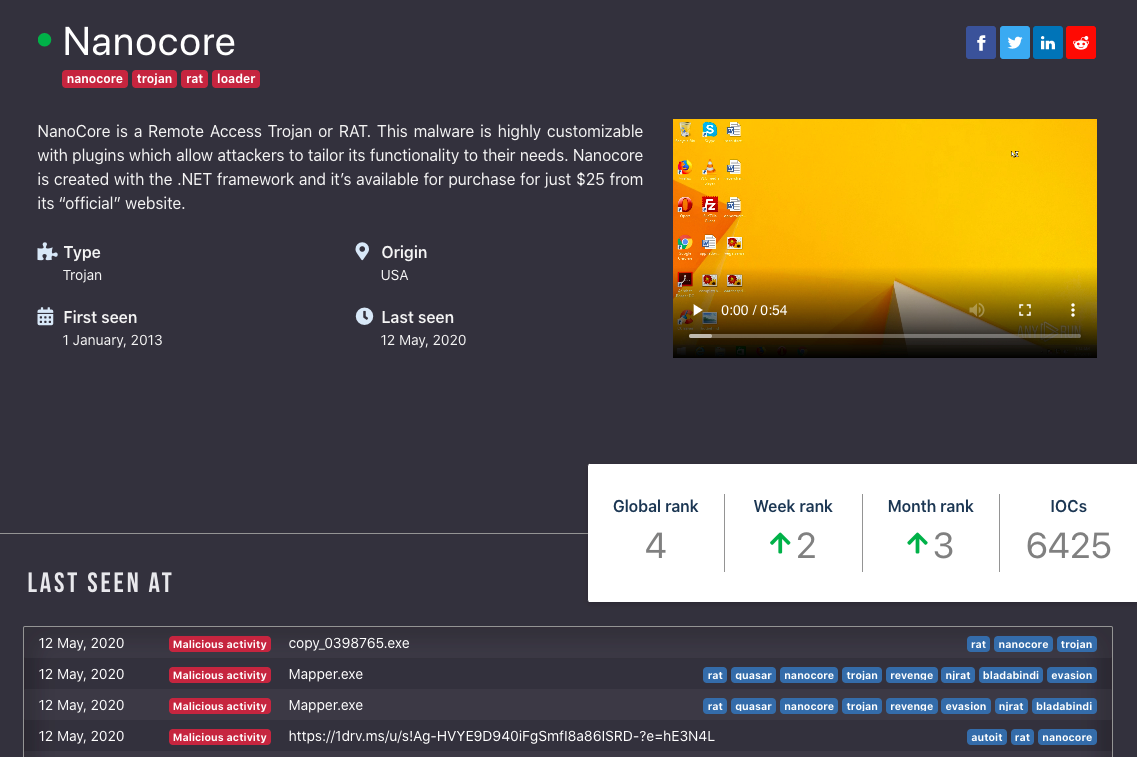
Click on a cell with a malware name to see information about this malicious family:
- malware description;
- malware history;
- video with typical execution;
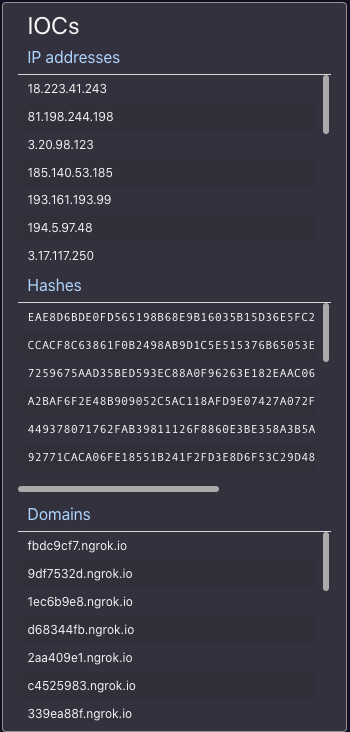
- IOCs list with the last 20 IP addresses ;
- hashes;
- domain names.
Conclusion
Interactive sandbox ANY.RUN allows performing a static and dynamic analysis of malicious programs. It has 3 types of plans that meet users’ demands: Community, Hunter, and Enterprise Suite. The main benefit of ANY.RUN is a community plan without monthly payment that has all the necessary features for a proper analysis.
Paid plans give extra opportunities for more advanced and less popular malware types that require detailed configurations of a sandbox and let manage a team for shared sample investigation. Learn more about our plans here.
ANY.RUN is an interactive and easy-to-use service. You get the first results right after launching a task. You can also watch malware’s actions in real-time, change the system’s configuration, and get a detailed report at the end of the investigation. The report has an accessible format that will be clear even for junior malware specialists. Beginners and advanced analytics will find ANY.RUN useful as it makes their work faster and more productive.
6 comments


You made some decent points there. I looked on the internet for the difficulty and found most individuals will associate with together with your website.
Hello. magnificent job. I did not imagine this. This is a impressive story. Thanks!
Cool, I’ve been looking for this one for a long time
very good
Good point, makes a sence especially when one is experienced in the topic. So keep righting and share your thoughts and experiences.
hello everyone