ANY.RUN is an online sandbox designed for real-time malware analysis. It provides instant threat assessments and lets you interact with potentially harmful samples safely within a virtual machine.
Our sandbox is easy to start with but has deeper features you’ll want to master. In this article, we’ve compiled a list of less obvious but highly useful features that can make a big difference in specific situations.
Let’s get started!
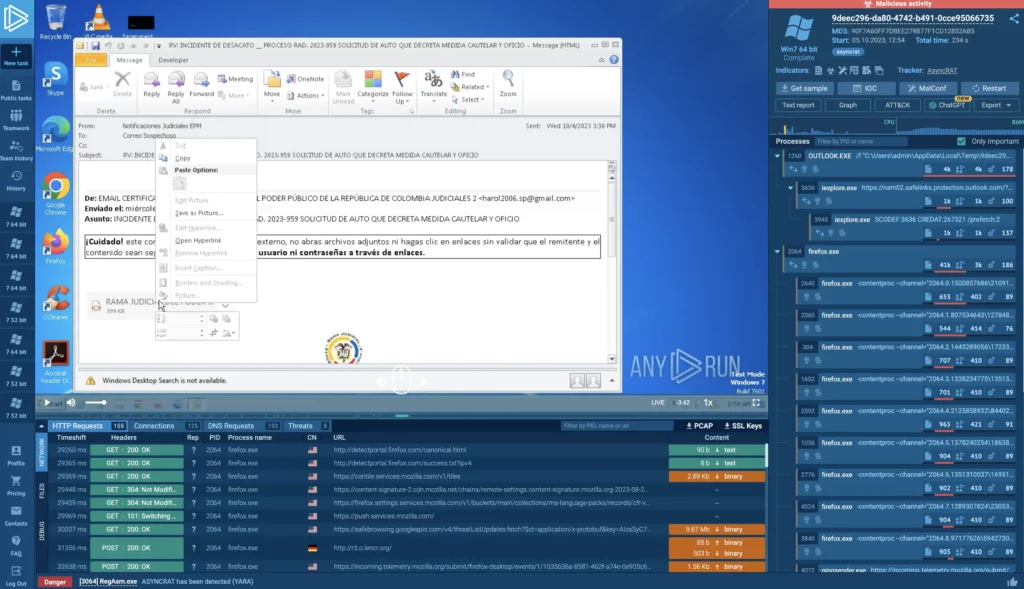
Task home screen tips and tricks
On the main task screen — which is shown above — you can access VM emulation through our VMC stream. It also shows real-time activity for processes, files, and network traffic.
The interface focuses on delivering key insights quickly and is generally self-explanatory. However, there are some tips and tricks worth noting.
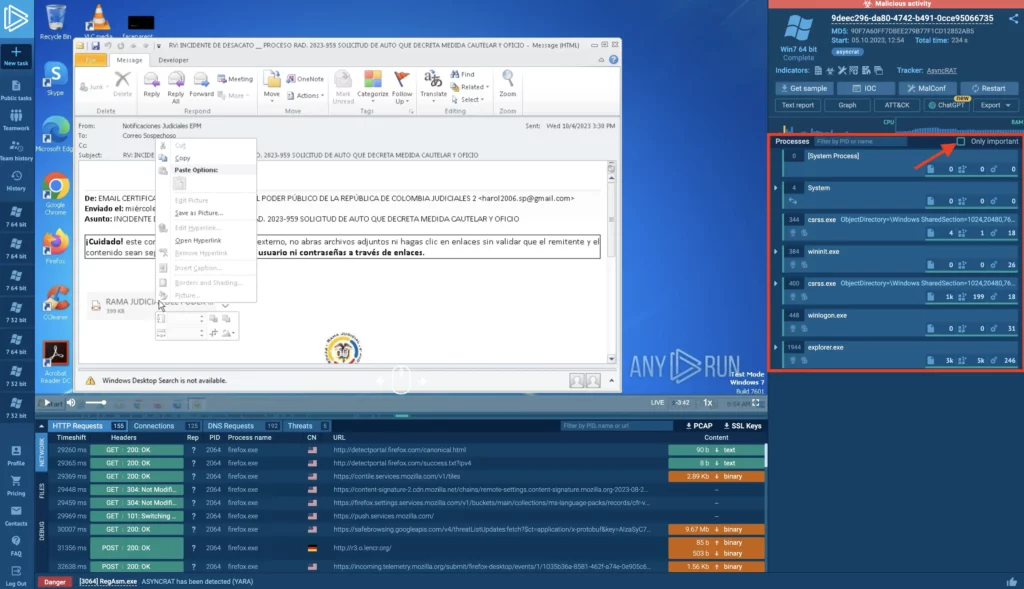
1. Unchecking “Only important”
By default, the process view displays only important, malicious or suspicious processes. To see all processes running in the virtual machine, simply uncheck this filter.
This can be useful when you’re conducting a deep-dive analysis and don’t want to miss any potential IOCs. Sometimes, even processes that appear benign can exhibit malicious behavior when looked at in the context of other system activities.
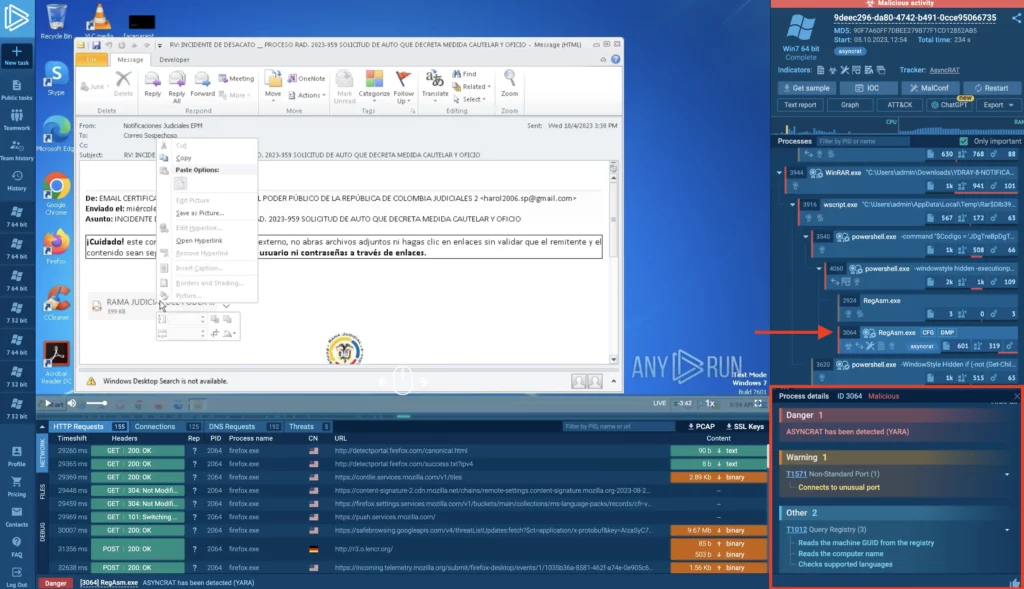
2. Viewing TTPs for each process
You can click on a process to view its details, then scroll down to see a list of Tactics, Techniques, and Procedures generated by that process. TTPs give you insights into the threat’s behavior and containment strategies.
This feature let’s you quickly get a clear view of what the malware aims to do — whether it’s lateral movement, data exfiltration, privilege escalation, or any other suspicious activities. This knowledge helps you to prioritize your containment and mitigation steps effectively, allowing for a more targeted response.
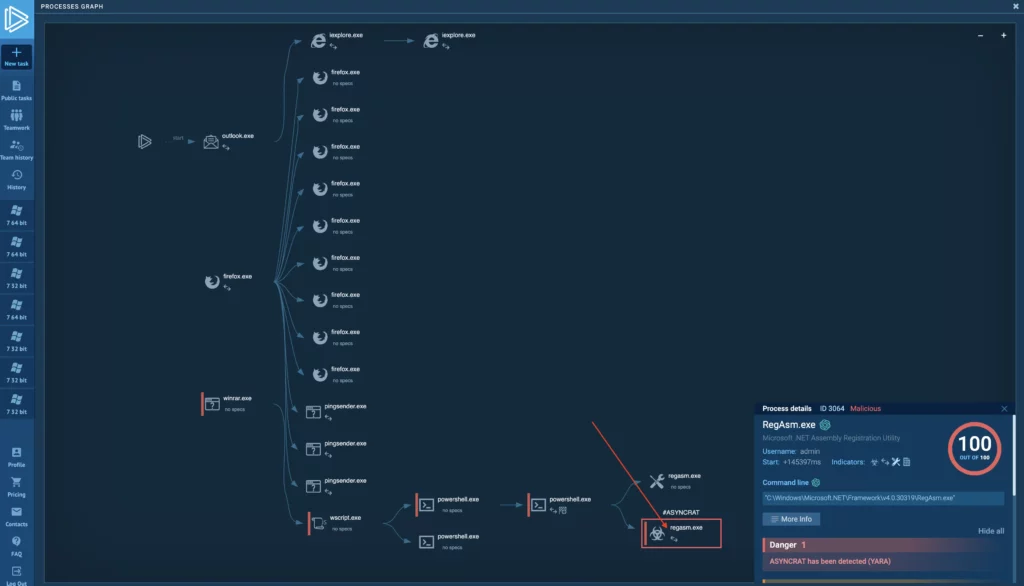
3. Accessing process details from graph view
You don’t have to leave the graph view to see process details. Just click on any process and the same pop-up you’d see in the process tree will appear.
This is very useful when so many processes spawn that they do not easily fit into the process tree view. Also, this feature saves you extra clicks and, more importantly, lets you analyze process details while also viewing their connections to other activities of the sample.
4. Accessing the full screen or new window mode
While the task is active, you can switch to full-screen VNC stream mode or open the VNC screen in a separate window.
This is useful for focusing on the VNC content, displaying it on a different monitor, or running a demo using our virtual machine to mimic a real computer.
5. Learning more about a threat in our Tracker
Our Malware Trends Tracker gives you details on recent samples, their popularity, and associated IOCs from public tasks that detected the threat. It also outlines the threat’s general behavior and execution patterns.
You can quickly jump to MTT to learn about the malware you are dealing with by clicking on the link in the top-right corner of the screen. This is also very useful for quickly collecting IOCs from a range of similar samples encountered by other researchers.
Advanced processed details tips and tricks
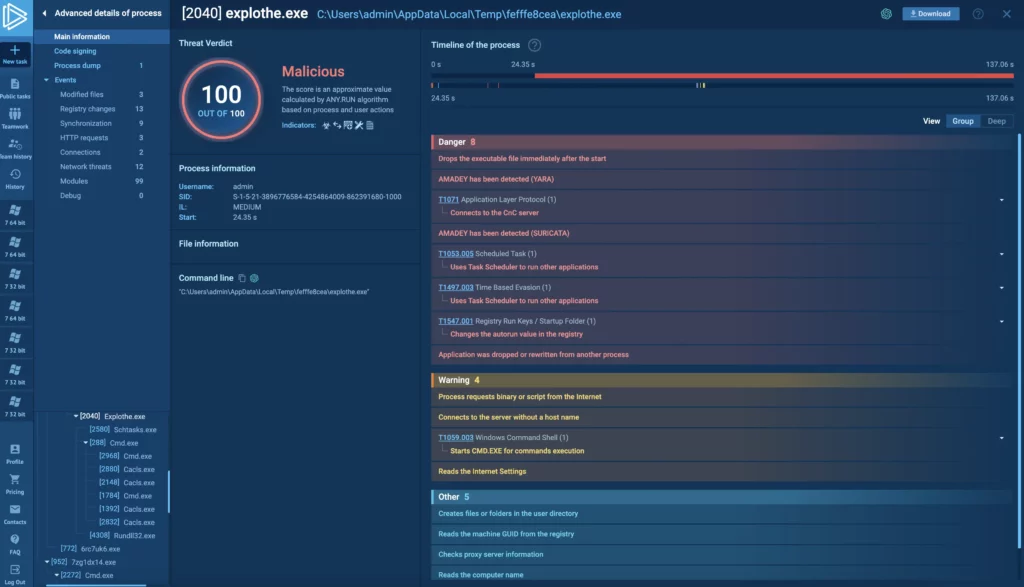
Clicking More info after selecting a process in the tree or graph takes you to a view showing in-depth event information for that process.
This view — called Advanced Process Details or ADP — is handy for deep investigations, letting you examine specific behaviors like HTTP request content. Here are a few handy tips for working with the ADP view.
6. Viewing ChatGPT reports for individual events
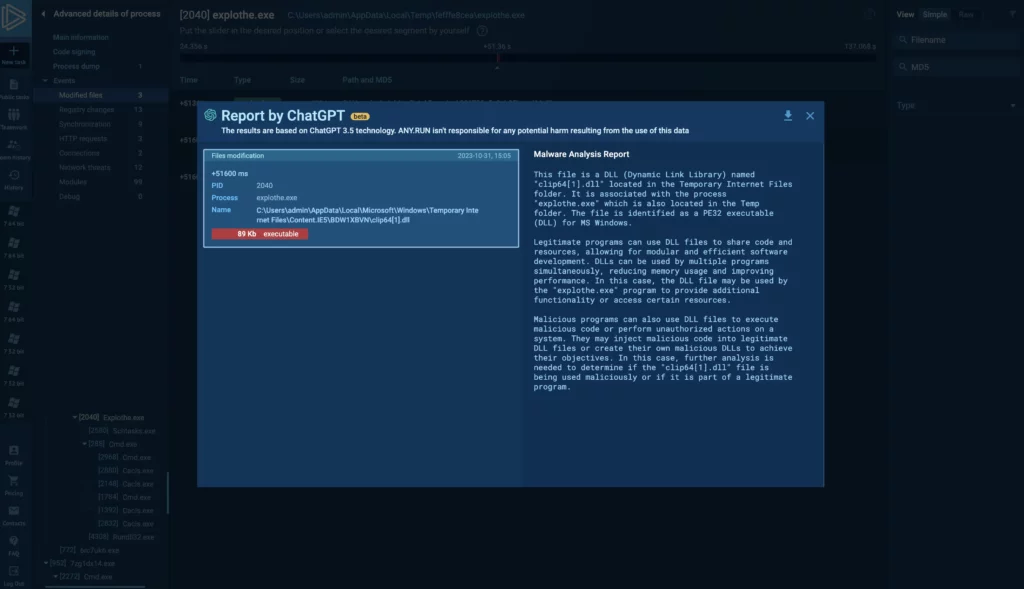
You can generate ChatGPT reports that focus on the entire task or choose to narrow it down to specific events. Just select an individual event from the event list to create a targeted AI report. This works for modified files, registry changes, synchronization, and HTTP requests.
Using ChatGPT reports to focus on individual events simplifies the interpretation process. For a malware analyst, you get plain-English explanations of events like modified files or HTTP requests. This helps you quickly grasp the implications of each event.
Note, that due to data privacy considerations ChatGPT reports currently only work for public tasks.
7. Using RAW mode view to see more events
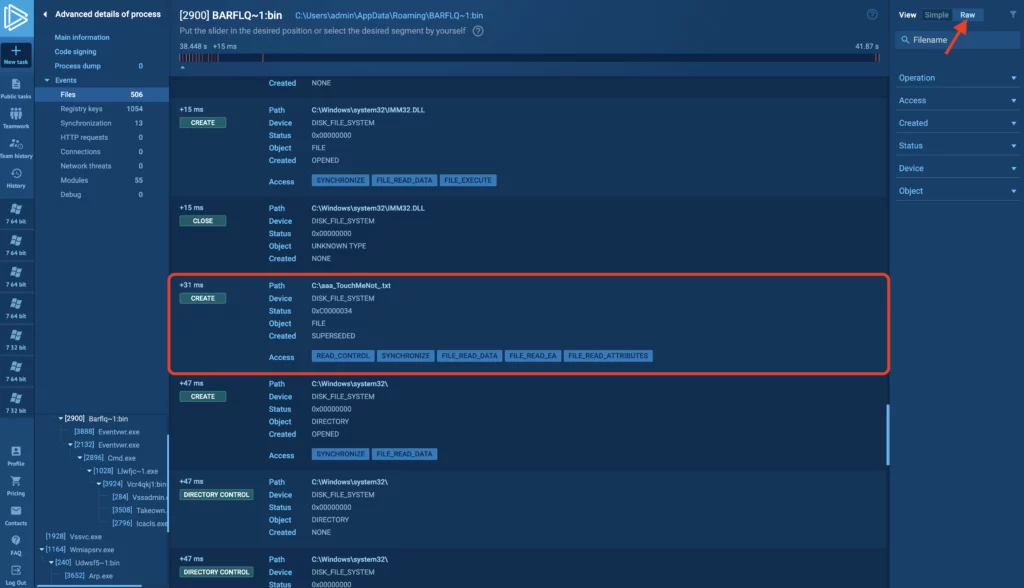
By default, opening an events tab displays it in Simple mode. This filters events to only show the most critical ones. For instance, in the Modified files tab it highlights file changes like file modifications, creations, and deletions. However, simple mode might not give you a comprehensive view of what’s happening.
For example, some malware variants check the presence of files and directories specific for AV software. They halt their execution if they detect AV software capable of identifying them. Switching to Raw view expands the filter criteria, revealing additional events. In the example task above, if the aaa_TouchMeNot.txt file is present, the malware doesn’t execute. Being able to see additional events is crucial for gaining a complete understanding of the execution process.
8. Analyzing certificates
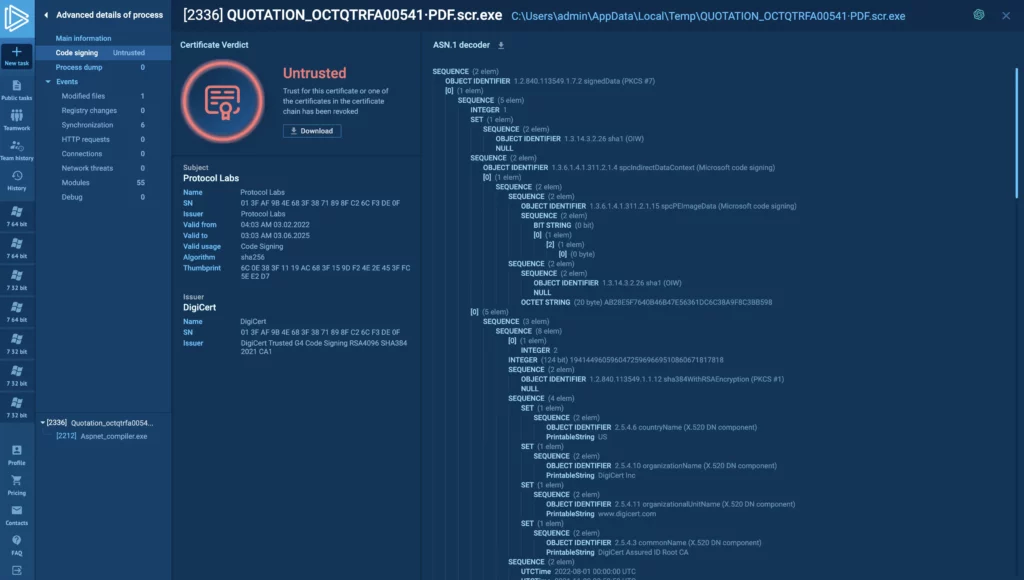
Go to the code signing tab to see detailed information on certificates for both the module and the process — as shown in this task. You can also download them. Watch out for unsigned, expired, or untrusted certificates as they’re often signs of malicious content. For additional verification, you can generate a ChatGPT report specifically focused on the certificate.
Ultimately, identifying problematic enables faster decision-making on whether a process or module is malicious.
Wrapping up
Those are some under-the-radar tips to help you maximize your use of ANY.RUN. Did you find these tips useful? Want more compilations like this? Share your thoughts in the comments below.
A few words about ANY.RUN
ANY.RUN is a cloud malware sandbox that handles the heavy lifting of malware analysis for SOC and DFIR teams. Every day, 300,000 professionals use our platform to investigate incidents and streamline threat analysis.
Request a demo today and enjoy 14 days of free access to our Enterprise plan.






0 comments