


Editor’s note: The current article was originally published on December 16, 2021, and updated on December 19, 2023.
Every day researchers upload about 8,000 submissions to ANY.RUN sandbox, many of them with malicious verdicts. Cyberthreats are a global danger, and being up to date is a must for any specialist. That’s why we created Malware Trends Tracker.
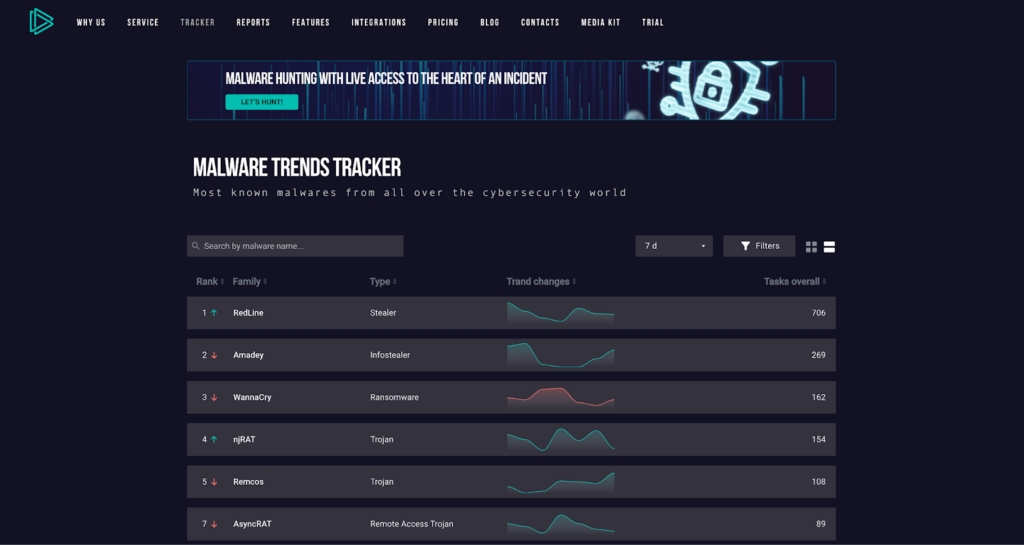
What is Malware Trends Tracker?
ANY.RUN is committed to improving cybersecurity awareness and threat intelligence. That is why we created Malware Trends Tracker (MTT). Here you can find:
- Dynamically updated statistics of malware activity
- Real-time breakdown of the most popular threats
- Latest IPs, hashes, domains and URLs of each malware
- Descriptions and execution flow summaries for different malicious programs
The results are based on data gathered from ANY.RUN’s public submissions. Our database consists of nearly 5 million uploads and is constantly growing — that’s how we’re able to provide reliable statistics, which are searchable by GEO and time period.
How to monitor malware trends?
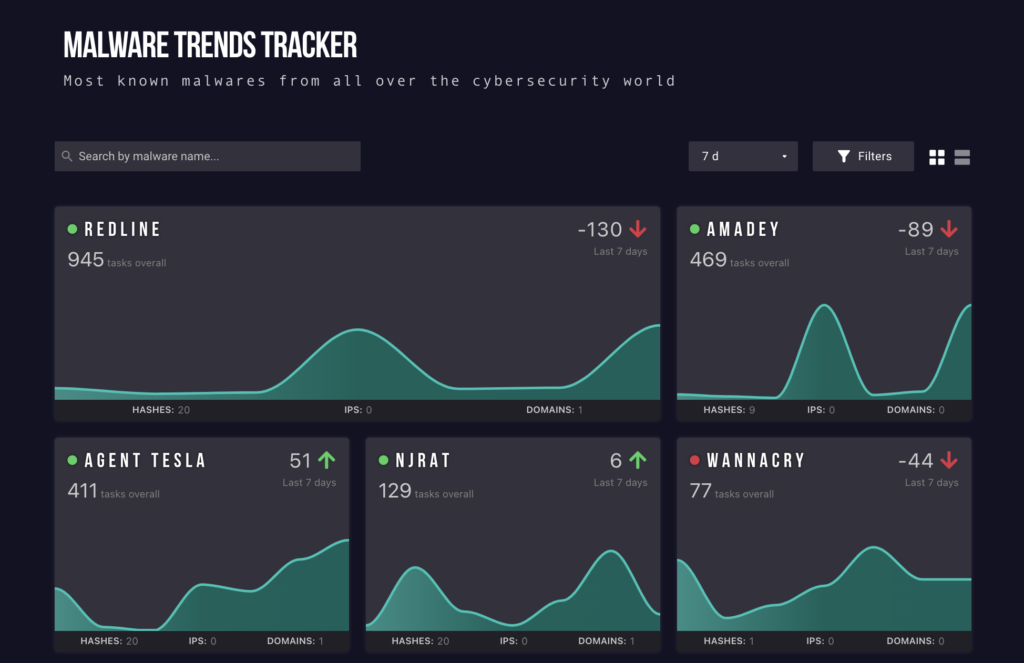
Widgets of each malware show the overall number of sandbox tasks where that family has been seen. Using the popularity graph, look out for patterns of peak and off-peak activity. This usually indicates if an active campaign is running.
For example, taking this Emotet widget as a case study it’s obvious that the number of uploads rocketed and then plummeted within a year. The dip is when threat actors were arrested, stopping all activity.
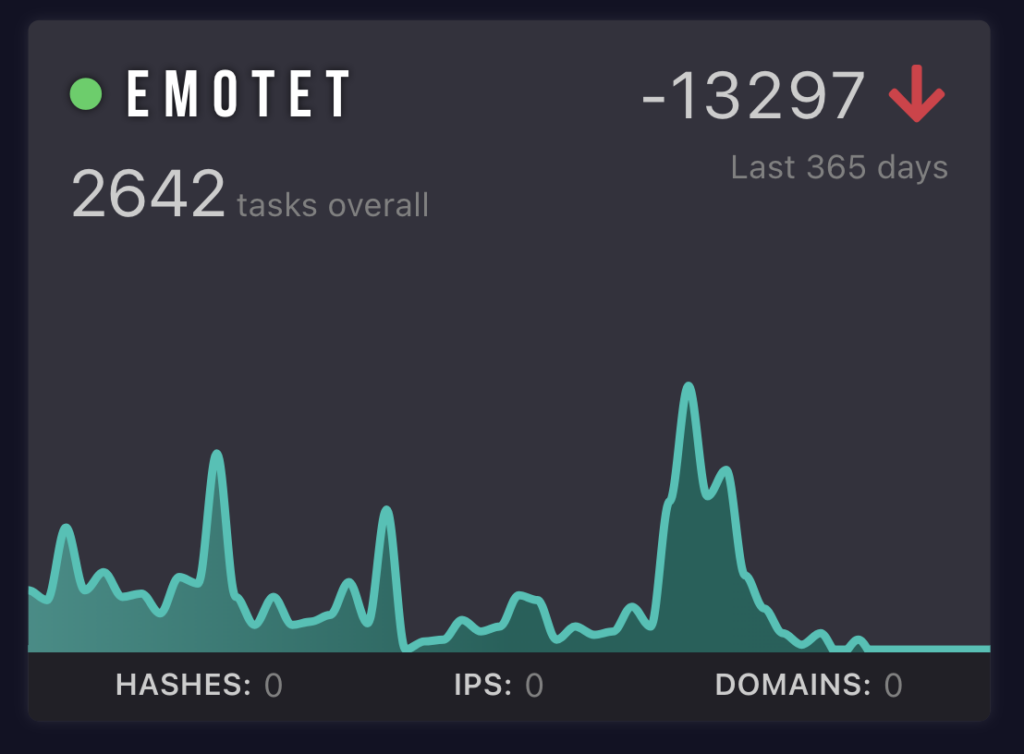
We like to use this as an identifier for what the hot malware is at the time and what most people are encountering in the field. It can be offset by automation or old samples but in general, most people are not automating or have access to your API so we see it as a good organic measurement. In particular, when Emotet spikes up we see that as a good indicator of infections going up.
@Cryptolaemus1, a team of cybersecurity analysts, learn more on their blog
Each malware name goes with green or red symbols. These are the signs of active and non-active malware that are there in the wild.
If you want to see the number of uploads, you can choose an indication over a specific period: all time, a year, month, two weeks, or a week. The arrow presents the rise or decline of malware within a particular time.
Hashes, IPs, and domains of a particular malware program are at the bottom of the widget, so you can plan how many of them you can investigate.
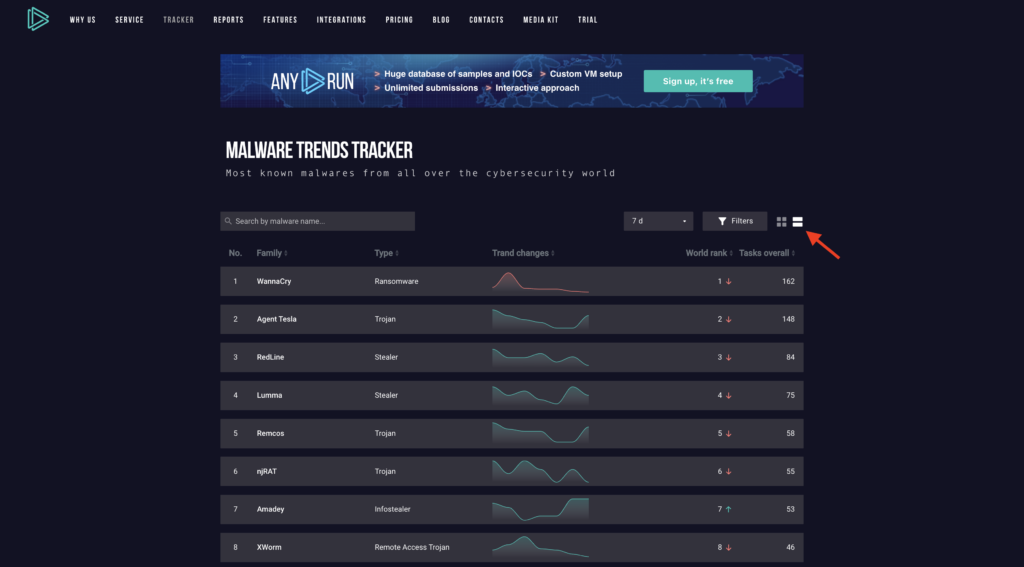
And if you want a view that shows a bigger picture, choose the list view option, which fits more malware families on the screen. Useful if you want to compare popularity trends across a wider selection range.
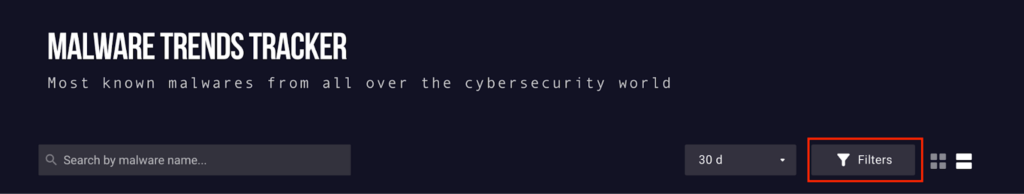
Use Filters to look for specific threats
Imagine you need to track the popularity of RATs in the US over the past month. This is where filters come into play. They’re designed to simplify your search. You’ll find the filter icon located in the navigation panel. Click on it to start tailoring your results.
Once you click on the filter icon, a sliding menu will appear on the left side of your screen. This feature allows you to refine your search based on several criteria:
- The country where the sample was uploaded
- The type of malware
- The malware family (particularly useful if you’re tracking a specific strain)
To apply a filter, simply type to search or scroll until you find the desired filter option. Then, just mark the appropriate checkbox to narrow down your results.
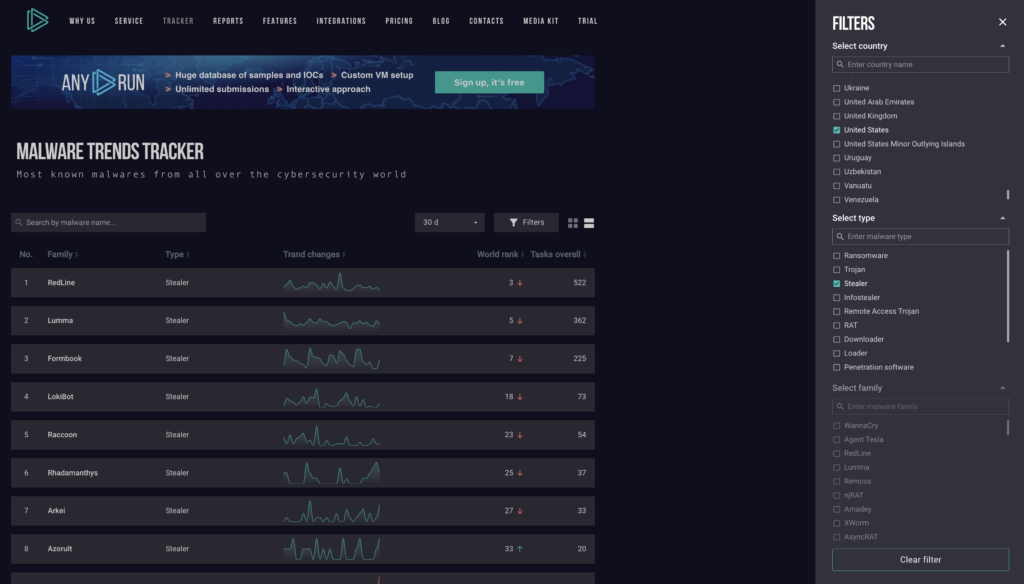
As you can see, Stealer usage has decreased slightly over the last 30 days in the US, as of the time of writing.
This kind of targeted search can help you anticipate potential threats your organization might face in the future. With this information in hand, you can proactively adjust your security strategy as required, ensuring your defenses are always one step ahead.
The latest data on malware
When you encounter malware of any type for the first time, you would rather know everything about it. And here you are. All detailed information about the object of your analysis is here, in MTT. The articles contain new information that is provided by the latest submissions and reports.
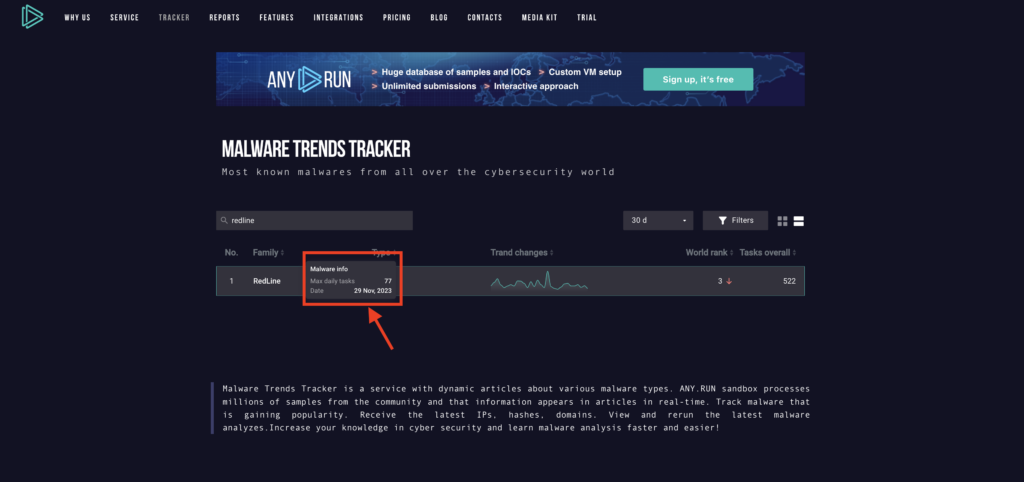
Choose a malware you want to know about and click on its widget. You can also hover over the malware in list view to bring up additional information:
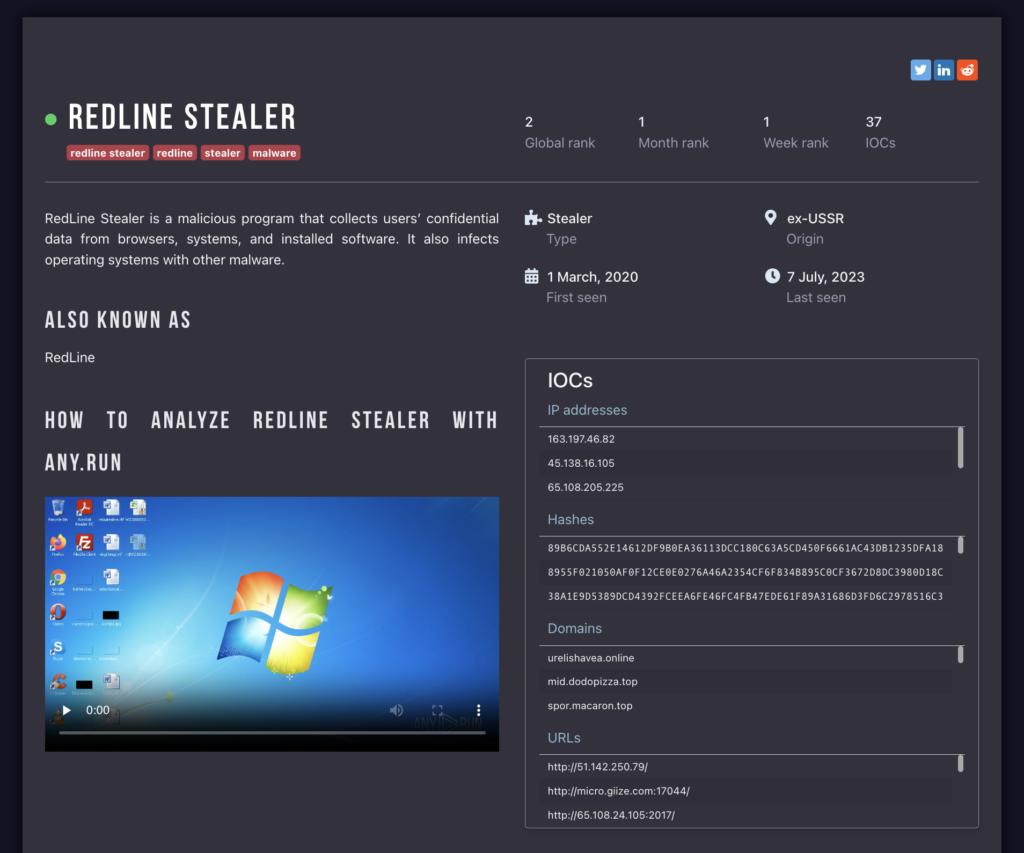
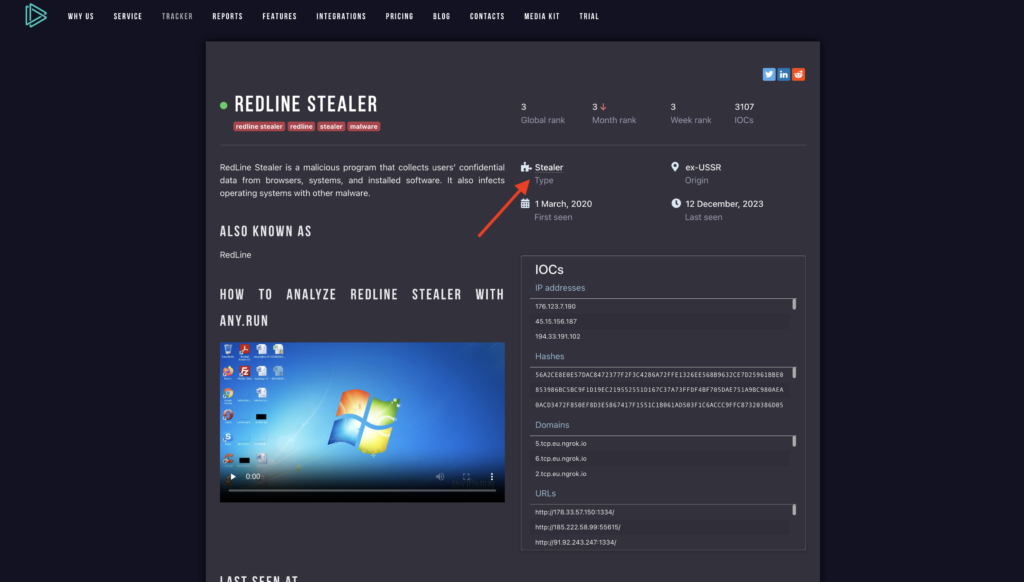
On the malware page, you can find the following details:
- malware description
- malware history
- recent samples
- malware distribution method
- malware execution video
- detection process
- global, week, and month ranks
- IOCs – latest IP addresses
- Hashes
- domain names
- URLs
For example, here’s a slice of IOC data about Redline, taken at the time of writing:
| IPs | Hashes | Domains | URLs |
|---|---|---|---|
| 176.123.7.190 | 56A2CE8E0E57DAC8472377F2F3C4286A72FFE1326EE568B9632CE7D25961BBE0 | 5.tcp.eu.ngrok.io | http://178.33.57.150:1334/ |
| 45.15.156.187 | 853986BC5BC9F1D19EC219552551D167C37A73FFDF4BF705DAE751A9BC980AEA | 6.tcp.eu.ngrok.io | http://185.222.58.99:55615/ |
| 194.33.191.102 | 0ACD3472F850EF8D3E5867417F1551C1B061AD503F1C6ACCC9FFC87320386D05 | 2.tcp.eu.ngrok.io | http://91.92.243.247:1334/ |
| 38.47.221.193 | E658A5B736828E06A859FE0CD526310E7B89A2EDE6F81929249D91521343505F | ezeeshopper.com | http://103.173.227.25:12664/ |
| 206.123.140.95 | F9670A844453E56898ED4C23AFE57DFA2CD20F28AE8E97DF4C7304371E1B179B | 0.tcp.eu.ngrok.io | http://185.222.58.246:55615/ |
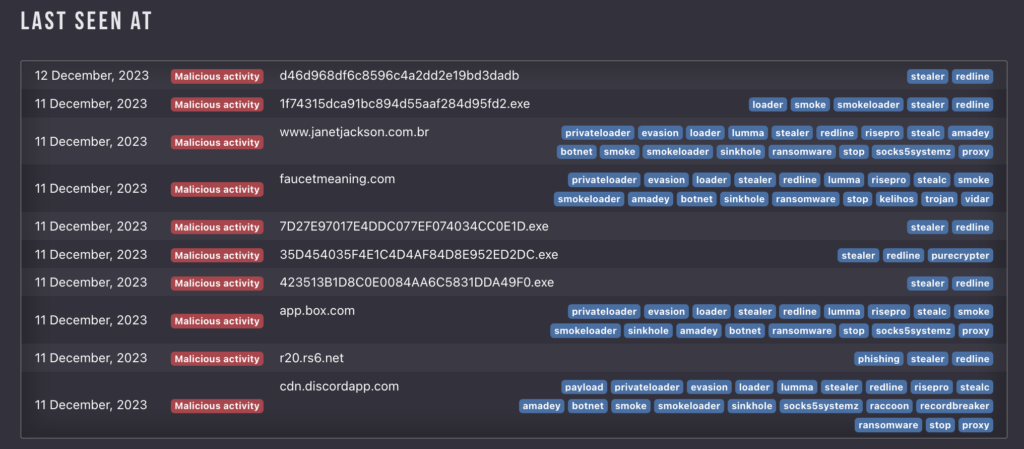
You’ll also see a list of the latest tasks where Redline was identified. These are clickable, allowing you to easily see that particular submission. This is useful if you need to collect more data or re-run the task in a different VM configuration.
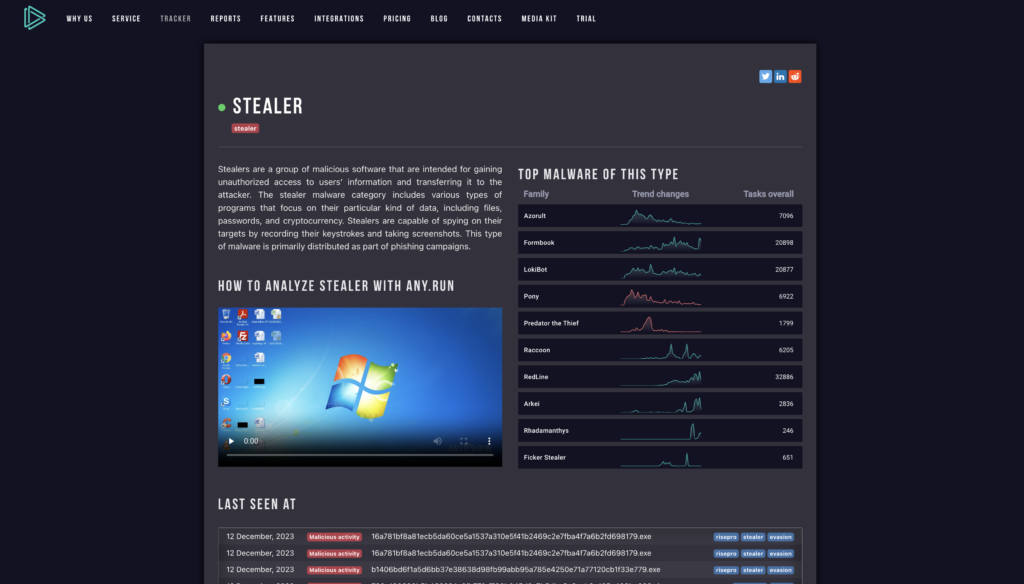
Read about malware types
In Trends tracker, you can also find information about different types of malware, (stealers, ransomware, trojans and so on).
Click on the malware type within the malware page to access the most recent information on this specific malware category. This includes the latest IOCs and a detailed description of characteristics typical for this type, which is useful when you want to brush up on fundamentals.
Why do you need malware statistics and trends?
Malware statistics and trends are an effective source for security specialists. Recent threat dynamics can help predict future trends of malware and possible attacks, enhance defense strategy, and understand the behavior of existing malicious objects.
Trends tracker gives that visual connection that transforms information into intelligence.
About ANY.RUN
ANY.RUN is an interactive sandbox that handles the heavy lifting of malware analysis for SOC and DFIR teams. Every day, 300,000 professionals use our platform to investigate incidents and research threats. Request a demo to test our sandbox for free in the next 14 days.
1 comments


Nice Blog, thanks for sharing